This example was designed on the base of infographic "International education" from the Great Britain Government website.
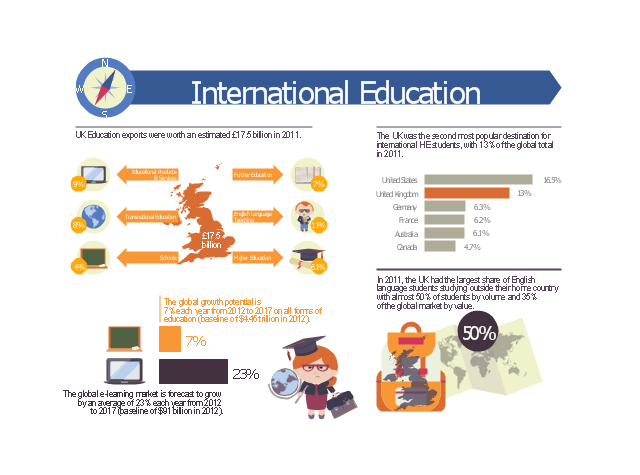
"UK Education exports were worth an estimated £17.5 billion in 2011.
The UK was the second most popular destination for international HE students, with 13% of the global total in 2011.
The global growth potential is 7% each year from 2012 to 2017 on all forms of education (baseline of $4.45 trillion in 2012).
In 2011, the UK had the largest share of English language students studying outside their home country with almost 50% of students by volume and 35% of the global market by value.
The global e-learning market is forecast to grow by an average of 23% each year from 2012 to 2017 (baseline of $91 billion in 2012)." [gov.uk/ government/ uploads/ system/ uploads/ attachment_ data/ file/ 225562/ international-education-industrial-strategy-infographics.pdf]
The educational infogram "International education" was created using the ConceptDraw PRO diagramming and vector drawing software extended with the Education Infographics solition from the area "Business Infographics" in ConceptDraw Solution Park.
Educational infogram
This example was designed on the base of infographic "Minnesota measures 2014. A report on higher education performance" from the website of the Minnesota Office of Higher Education (OHE).
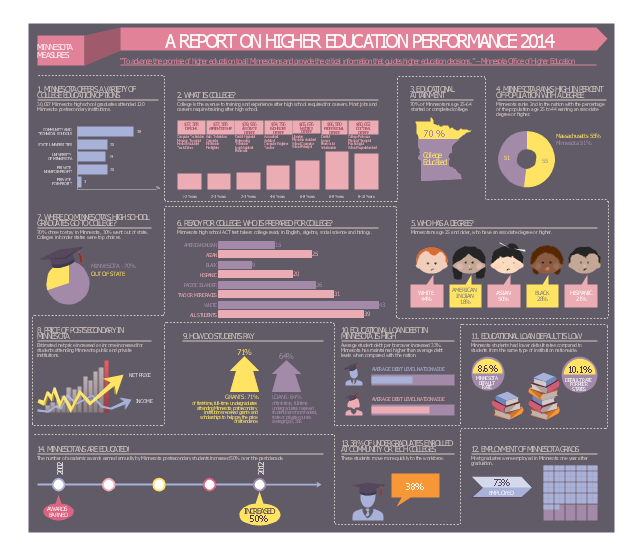
"The Minnesota Office of Higher Education is a cabinet-level state agency providing students with financial aid programs and information to help them gain access to postsecondary education. The agency also serves as the state’s clearinghouse for data, research and analysis on postsecondary enrollment, financial aid finance and trends." [ohe.state.mn.us/ pdf/ MN_ MeasuresInfographic.pdf]
The infographic example "Minnesota measures" was created using the ConceptDraw PRO diagramming and vector drawing software extended with the Education Infographics solition from the area "Business Infographics" in ConceptDraw Solution Park.
Educational infogram
Used Solutions
Maps
>
Column Chart Examples

Bar Diagram Math

 Language Learning
Language Learning solution extends ConceptDraw PRO software with templates, samples and library of vector stencils for drawing the sentence diagrams.
Bar Diagrams for Problem Solving. Create space science bar charts with Bar Graphs Solution

Bar Diagrams for Problem Solving. Create manufacturing and economics bar charts with Bar Graphs Solution

 Divided Bar Diagrams
The Divided Bar Diagrams Solution extends the capabilities of ConceptDraw PRO v10 with templates, samples, and a library of vector stencils for drawing high impact and professional Divided Bar Diagrams and Graphs, Bar Diagram Math, and Stacked Graph.
 AWS Architecture Diagrams
AWS Architecture Diagrams with powerful drawing tools and numerous predesigned Amazon icons and AWS simple icons is the best for creation the AWS Architecture Diagrams, describing the use of Amazon Web Services or Amazon Cloud Services, their application for development and implementation the systems running on the AWS infrastructure. The multifarious samples give you the good understanding of AWS platform, its structure, services, resources and features, wide opportunities, advantages and benefits from their use; solution’s templates are essential and helpful when designing, description and implementing the AWS infrastructure-based systems. Use them in technical documentation, advertising and marketing materials, in specifications, presentation slides, whitepapers, datasheets, posters, etc.
- Education Bar Chart
- UK Map | The most spoken languages of the world | Language ...
- Composition Dashboard | Bar Graphs | Design elements - Education ...
- Design elements - Education backgrounds | Design elements ...
- Drawing Chart Of Education
- How it works : eLearning | International education | Map of UK ...
- Minnesota measures - Infogram | Education infogram - Template ...
- Basic Divided Bar Diagrams | Geo Map - World | Education Package ...
- Education infogram - Template | Education infogram 5 - Template ...