How to Create a Bar Chart
The answer how to create a bar chart can be found in ConceptDraw software. The simple tips guide you through the software to quickly learn how to create a bar chart.How to Create a Pie Chart
Create a Pie Chart with ConceptDraw software quickly and easily. The simple tutorial helps you learn how to create a pie chart.How to Create a Scatter Chart
Simple tutorial help you learn how to draw a scatter chart and increase you possibilities of understanding and work more effective with our scatter chart software.How to Create a Line Chart
Create a Line Chart with ConceptDraw using our tips. Here you can find an explanation of how to create a line chart quickly.HelpDesk
How to Create a Gantt Chart for Your Project
Instruction on how to create Gantt chart using ConceptDraw PROJECT software.Gant Chart is a graphical representation of tasks as segments on a time scale. It helps plan or overlapping.
How to Create Gantt Chart
To begin managing a new project, you will need to define the individual Tasks that must be completed to deliver it. The default view for a new project in ConceptDraw PROJECT is the Gantt Chart.How to Discover Critical Path on a Gantt Chart
ConceptDraw PROJECT is the Gantt chart software that implements critical path method to provide the user with a wide set of project management tools.How to Create a Pyramid Diagram
ConceptDraw Pyramid Diagram software allows drawing column charts using predesigned objects or drawing tools. In ConceptDraw Pyramid Diagram software you can find a complete set of column chart tools and objects.HelpDesk
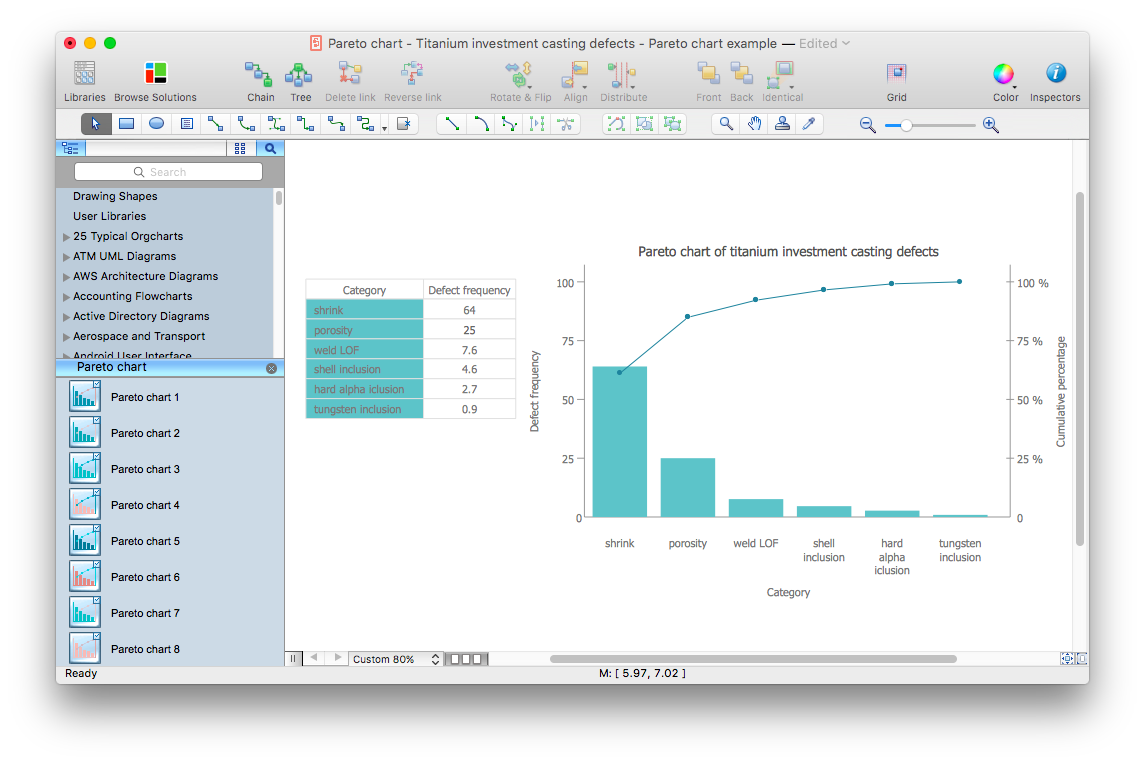
How to Draw a Pareto Chart Using ConceptDraw PRO
The Seven Basic Tools of Quality were picked as effective visual tool-set for identifying the root cause of quality-related problems within the workplace. Seven Basic Tools of Quality comprise of seven diagram that are diverse enough to be used to any business troubleshooting scenario, but simple enough that employees of all types can understand and apply them. One of these tools is a Pareto chart. It combines both a line graph and a bar chart, where the bar chart displays data values, and a line represents a total value. Pareto chart is used for quality control to identify the source of the quality problem.ConceptDraw Seven Basic Tools of Quality solution delivers a big set of vector stencil libraries and samples for each quality control diagram, including a Pareto chart.
HelpDesk
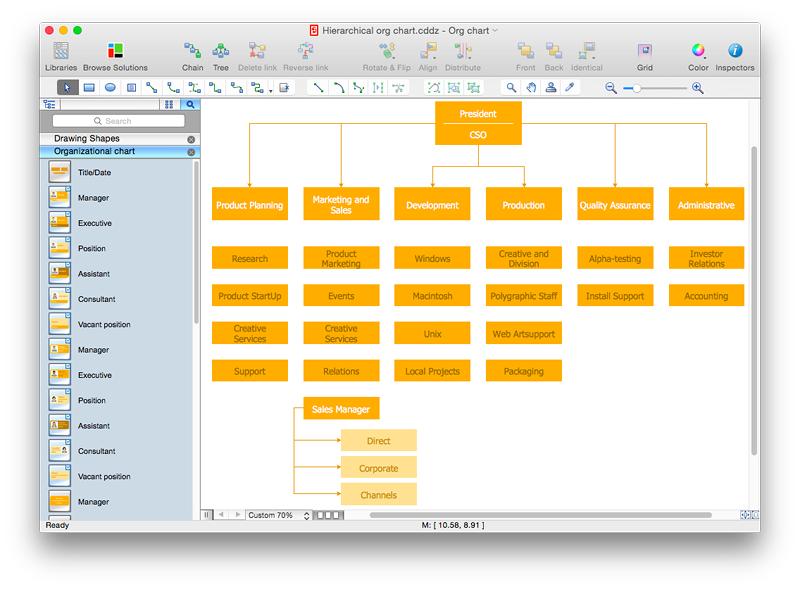
How to Draw a Hierarchical Organizational Chart with ConceptDraw PRO
There are a number of different organisational structures. The most appropriate structure will depend on the size of the business and the type of business. A hierarchical organizational structure is one of the most typical organizational structure. This structure can be represented as a pyramid, with a single entity in authority at the top, with subsequent levels of power beneath them. Each member of the pyramid reports only to their direct subordinates or superiors, limiting the amount of communication overhead, which can be seen both as an asset or a limitation. It is easy to see where a hierarchical structure would be an effective solution; companies that have offices based in disparate locations, a business that focuses on diversified markets, any organization with need for multiple levels of middle management. You can easily create a clear hierarchical organizational chart using ConceptDraw solution that contains templates of the 25 Typical Orgcharts.HelpDesk
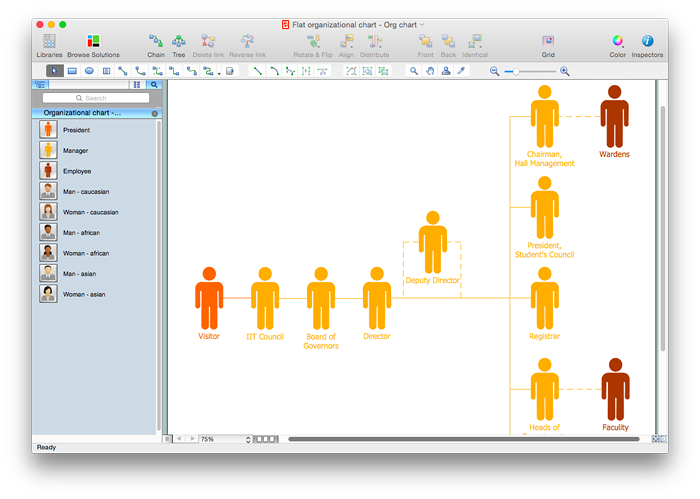
How to Draw a Flat Organizational Chart with ConceptDraw PRO
A clear organizational chart helps you to understand the relationships of positions in an organization in terms of authority and responsibility. A Flat organizational structure is one of the most typical organizational structure. Use The Flat Organizational chart template to draw an organizational structure of your company. ConceptDraw 25 Typical Orgcharts solution provides you with the possibility to develop typical organizational charts quickly and easily.HelpDesk
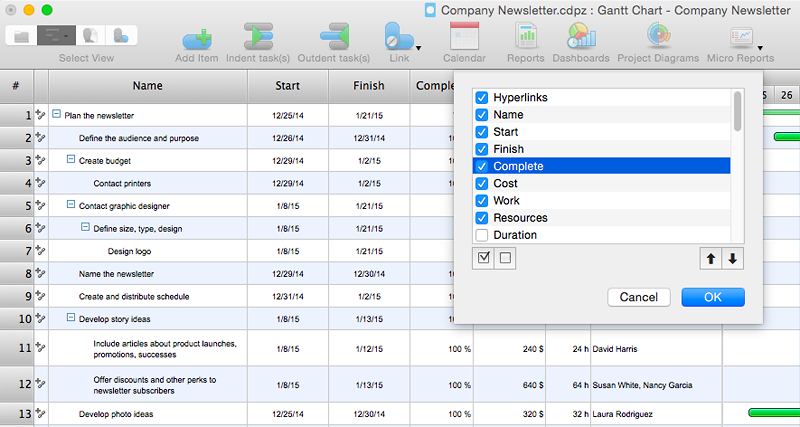
How to Customize the Columns in Your Project File
Some ConceptDraw PROJECT users need to start new projects from their custom default page. In this post we tell you how to make it.How to Report Task's Execution with Gantt Chart
ConceptDraw PROJECT’s powerful reporting engine lets you generate a set of tabular reports with just one click, or visualize your project as Radial Tasks Structures, Work Breakdown Structures and Resource Calendars. It also provides you with dynamic Project Dashboards.HelpDesk
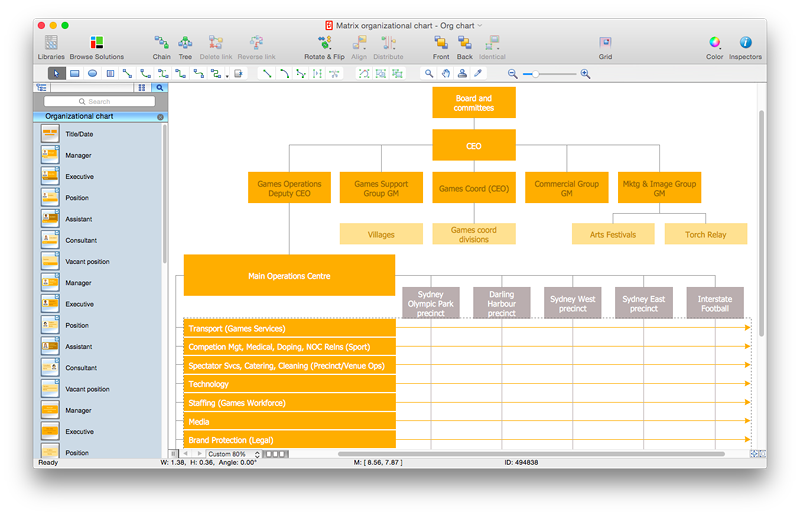
How to Draw a Matrix Organizational Chart with ConceptDraw PRO
There are a number of moments which are influenced on how the organizational structure of a certain business needs to be, how complex, and which type it should keep. The matrix organizational structure is atypical because it brings together employees and managers from different departments to work toward accomplishing a goal. This structure is commonly found in businesses that have more than one line of reportage. For instance, a company might contain an engineering department with engineering managers who workers report to. However, these workers might also have to liaise with different product or project managers depending on current tasks. Some form of matrix organization is found in most large-scale modern businesses. It is one of the most complicated reporting structures. You can easily build a clear matrix organizational chart in ConceptDraw PRO using templates from ConceptDraw Solution Park.HelpDesk
How to Draw a Scatter Diagram Using ConceptDraw PRO
Scatter Diagrams are used to visualize how a change in one variable affects another. A Scatter Diagram displays the data as a set of points in a coordinate system. It combines these values into single data points and displays them in uneven intervals. A Scatter Diagram can be very useful to for identifying relationships between variables, for example the relationship of price and quality rating. Making a Scatter Diagram involves many different elements that can be managed using ConceptDraw Scatter Diagram solution.- How to Report Task's Execution with Gantt Chart | How to Create ...
- How to Design a Good Workflow | Work Flow Process Chart | How to ...
- Simple & Fast Diagram Software | Work Flow Process Chart ...
- Gant Chart in Project Management | How to Create Presentation of ...
- HR management process - Flowchart | How To Create a Flow Chart ...
- Construction Project Chart Examples | Gantt chart examples ...
- Gant Chart in Project Management | Gantt chart examples | Gantt ...
- Gant Chart in Project Management | How to Draw a Gantt Chart ...
- Construction Project Chart Examples | How to Create Presentation ...
- Process Flowchart | Business diagrams & Org Charts with ...
- How to Design a Good Workflow | Work Flow Process Chart ...
- Gantt charts for planning and scheduling projects | Gant Chart in ...
- Gant Chart in Project Management | Project —Task Trees and ...
- PM Dashboards | How to Manage Multiple Projects on Windows ...
- Gantt chart examples | Examples of Flowcharts, Org Charts and ...
- How to Make a Mind Map from a Project Gantt Chart | How to Create ...
- Donut Chart Templates | Chart Templates | Organization Chart ...
- Gant Chart in Project Management | How to Create Presentation of ...
- Gantt chart examples | Gant Chart in Project Management | Gantt ...
- Process Flowchart | How to Report Task's Execution with Gantt Chart ...


