Products
Solutions
Samples
Contact Us
Buy
Helpdesk
✕
Sign In
Sign In
My ConceptDraw
Profile
Cart 
Activate
My Activated Licenses
Upgrade Information
Download Product
Open Support Ticket
Sign Out
This site uses cookies. By continuing to browse the ConceptDraw site you are agreeing to our Use of Site Cookies.
Helpdesk  >  ConceptDraw DIAGRAM  >    Business-specific Drawings

How to Draw a Pareto Chart

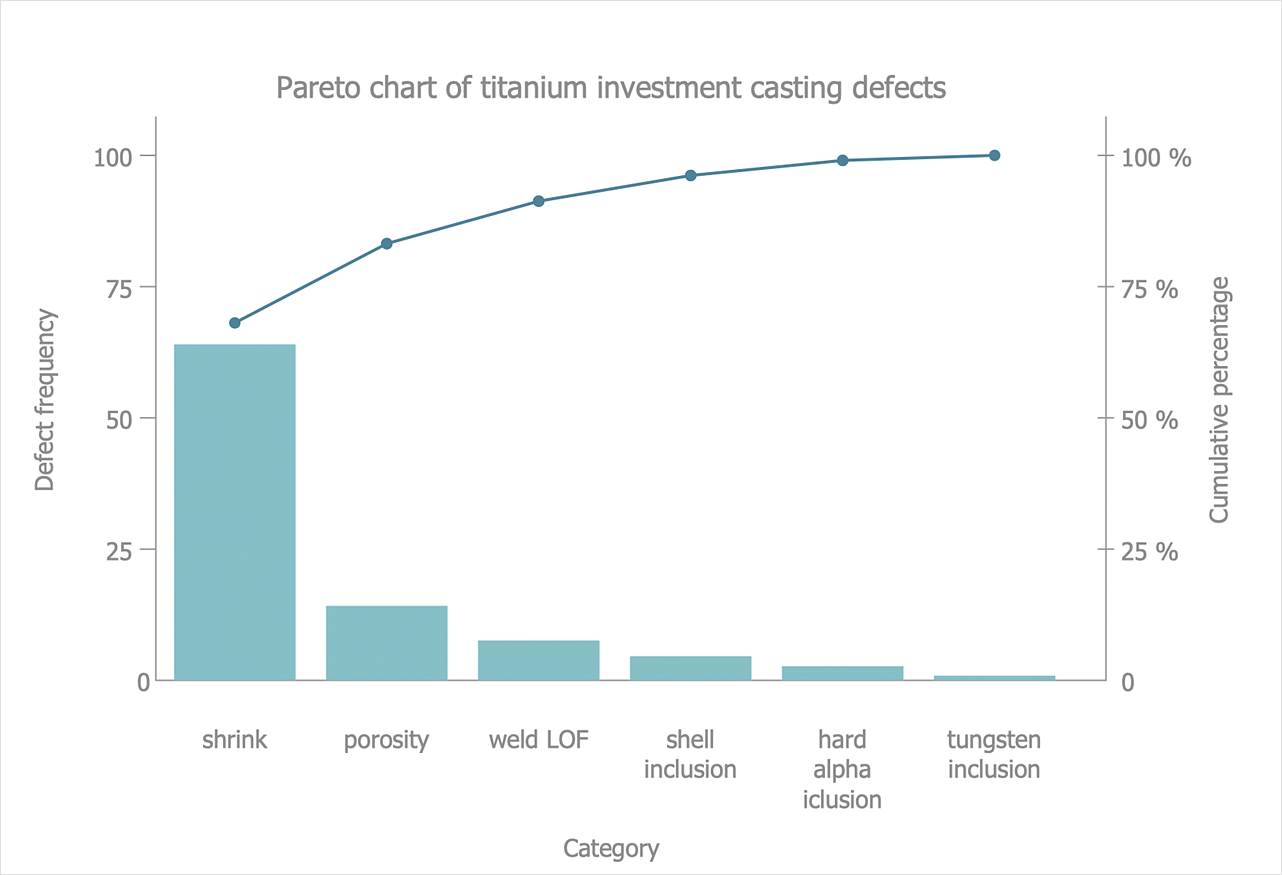
The Pareto chart is one of the seven basic tools of quality control. It combines both a bar chart and a line graph. You can create Pareto charts using the Seven Basic Tools of Quality solution. This solution is a paid add-on to ConceptDraw DIAGRAM. It provides individuals with extensive new libraries, templates and samples to assist in a quality control processes management.
  1. Run ConceptDraw DIAGRAM.
  2. Select the Seven Basic Tools of Quality solution in the Solutions panel.
  3. Doubleclick the preview of the Pareto Diagram library to open it in ConceptDraw DIAGRAM Now you have a workspace and a corresponding library.
  4. Add a diagram object to the drawing by dragging it from the library panel to the document page.
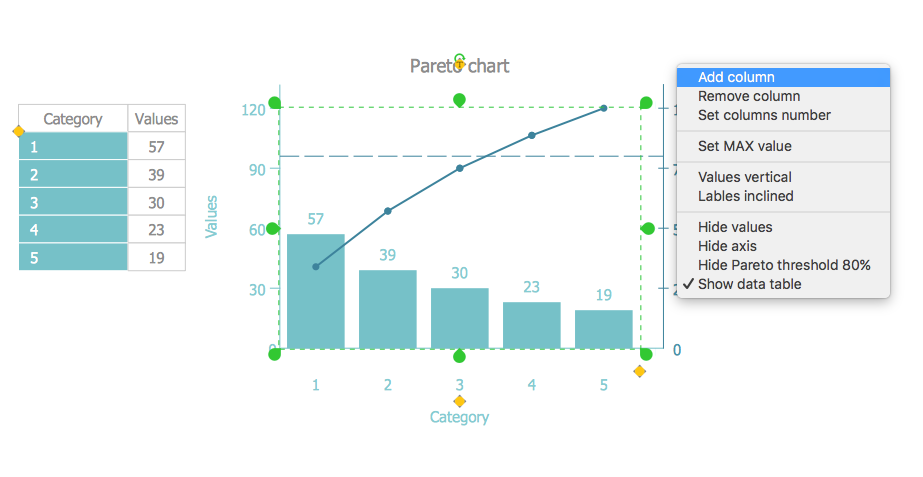
  5. Select an object and use the Action button action button menu to add/remove points or change the axis appearance.
  6. pareto chart
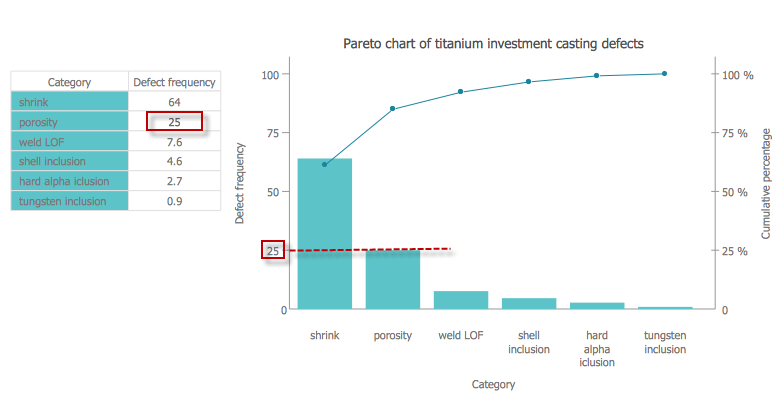
  7. To plot the data in the chart using the table click a table cell and enter the value of a point on the coordinate axes.
  8. pareto diagram
  9. To change the position of a point just change the value of the data in the table.
How to Draw a Pareto Chart

Result: Now your Pareto chart is ready! A Pareto chart can be used to quickly identify the most common problems or issues within a business process.

How it works:

  • Set of ready-to-use templates supplied with ConceptDraw DIAGRAM
  • Collection of professional samples supports each template
  • Professional drawing tools

Useful Solutions and Products:

Graphs and Charts
  • Easily draw different charts
  • Visualize business information
  • Capture a different phases of the project, using diagrams

Business Processes
  • Cross-Functional Flowcharts
  • Event-driven Process Chain Diagrams
  • Business Process Model and Notation (BPMN 2.0)
  • Workflow Diagrams

ConceptDraw DIAGRAM
  • Diagraming and Charts
  • Business Process diagrams
  • Business Process Modeling Notation (BPMN 2.0)
  • Business Model Presentation
  • Over 10 000 vector stencils
  • Export to vector graphics files
  • Export to Adobe Acrobat PDF
  • Export to MS PowerPoint
  • Export to MS Visio VSDX, VDX

Products

  • ConceptDraw OFFICE v11
  • ConceptDraw DIAGRAM v18
  • ConceptDraw MINDMAP v16
  • ConceptDraw PROJECT v15
  • ConceptDraw STORE
  • ConceptDraw BOOKS

Solutions

  • Free
  • Premium

Samples

Support

  • Technical Support
  • Upgrade Request
  • Visio File Conversion
  • System Requirements
  • Helpdesk
  • Students & Educators
  • Enterprise
  • Customer Service

Solutions

  • Free
  • Premium

Samples

Video Room

  • Products
  • Solutions

Ready To Buy

  • Buy Online
  • Reseller Partners
  • Manage Your Account
  • Download Your Software
  • CS Odessa

    • About Us
    • Contact Us
    • CS Odessa Identity
    • News
  • CS Odessa
    Plan. Do. Communicate.

    About Us | Contact Us | Feedback | EULA | Privacy | TOU | TOS
    © 1993 — 2025 CS Odessa Corp.