How to Create a Gantt Chart for Your Project
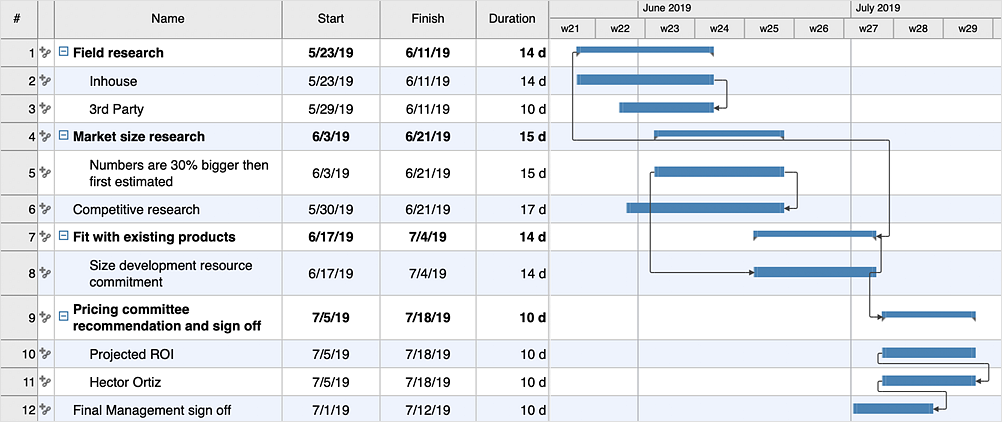
ConceptDraw PROJECT uses Gantt Charts to display project tasks and timelines. Gantt Charts are capable of displaying a large amount of highly detailed information in a visually pleasing, easy-to-understand format. This lets you see at a glance how well the various tasks and timelines are performing in your project. To begin managing a new project, you will need to define the individual Tasks that must be completed to deliver it. The default view for a new project in ConceptDraw PROJECT is the Gantt Chart view. The left pane of a Gantt chart displays a list of project Tasks. The right pane displays a calendar and timeline of those tasks.
- Run ConceptDraw PROJECT.
- By default, a new document will open in a Gantt Chart mode.
- The tools needed to create a Gantt chart for a new project can be found on the Home tab (Windows) or on the main toolbar (macOS).
- Click the Add button
 (Windows), (Windows),  (macOS) to create a new Task. (macOS) to create a new Task.
- Name the Task, and assign its duration. You can do so by double-clicking on the fields in the left pane of the Gantt chart and then typing on your keyboard.
- Group Tasks into Phases. Use the Indent button
 (Windows), (Windows),  (macOS) to subordinate a Task, thereby making the dominant item into a Phase. (macOS) to subordinate a Task, thereby making the dominant item into a Phase.
- To establish a relationship between Tasks, select two or more Tasks on the Gantt chart, and then click the Link button
 (Windows), (Windows),  (macOS). Editing the duration of linked Tasks will automatically adjust their position on the Gantt chart. (macOS). Editing the duration of linked Tasks will automatically adjust their position on the Gantt chart.

Result: Now you have outlined the Tasks that comprise your project along with their visual displaying as Gantt chart.
|
How it works:
- An extensive variety of reports on project and task statuses
- Centralizes project information via embedded documents and hyperlinks
- Managing multiple projects from a single file
- Powerful integration with other ConceptDraw products
Useful Solution and Products:
- Quickly start a project
- Plan and execute projects efficiently
- Visualize different phases of the project using diagrams
- Import and export MS Project® files
- Share your project data with MS Project®, Merlin®, and OmniPlan® users
- Report project status as a mind map
- ConceptDraw MINDMAP
Process, Brainstorming & Thought Organization
- ConceptDraw PROJECT
Project & Resource Management
- ConceptDraw DIAGRAM br>
Business Diagramming & Illustration
|
 Create Project File
  (Windows),
  (macOS) to create a new Task.
 (Windows),
  (macOS) to subordinate a Task, thereby making the dominant item into a Phase.
 (Windows),
  (macOS). Editing the