Pyramid Diagram and Pyramid Chart

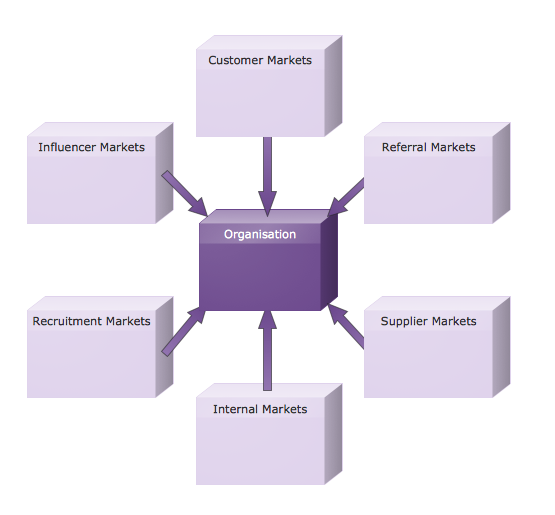
Six Markets Model Chart

 Marketing
This solution extends ConceptDraw DIAGRAM and ConceptDraw MINDMAP with Marketing Diagrams and Mind Maps (brainstorming, preparing and holding meetings and presentations, sales calls).
Customizable Six Markets Model Chart Template
Pyramid Chart Examples

Business diagrams & Org Charts with ConceptDraw DIAGRAM


Six Markets Model Chart Template

"A target market is a group of customers that the business has decided to aim its marketing efforts and ultimately its merchandise towards. A well-defined target market is the first element to a marketing strategy. The marketing mix variables of product, place (distribution), promotion and price are the four elements of a marketing mix strategy that determine the success of a product in the marketplace." [Target market. Wikipedia]
"An onion diagram is a kind of chart that shows the dependencies among parts of an organization or process. The chart displays items in concentric circles, where the items in each ring depend on the items in the smaller rings. ...
The Onion Diagram is able to show layers of a complete system in a few circles. Each of the circles is able to represent a component that is dependent upon the component on the inside of it shown by the circle inside of it. The main concept of the diagram is shown by the center circle of the diagram. This chart is used due to the fact that it has a clear visual representation that is easy to read, and it has a strong visual impact." [Onion diagram. Wikipedia]
This onion diagram (target diagram) example "Target market" was created using the ConceptDraw PRO diagramming and vector drawing software extended with the Target and Circular Diagrams solution from the Marketing area of ConceptDraw Solution Park.
www.conceptdraw.com/ solution-park/ marketing-target-and-circular-diagrams
Onion diagram

Marketing Analysis Diagram

 Target and Circular Diagrams
This solution extends ConceptDraw DIAGRAM software with samples, templates and library of design elements for drawing the Target and Circular Diagrams.
Business Tools Perceptual Mapping

Bar Diagrams for Problem Solving. Create event management bar charts with Bar Graphs Solution

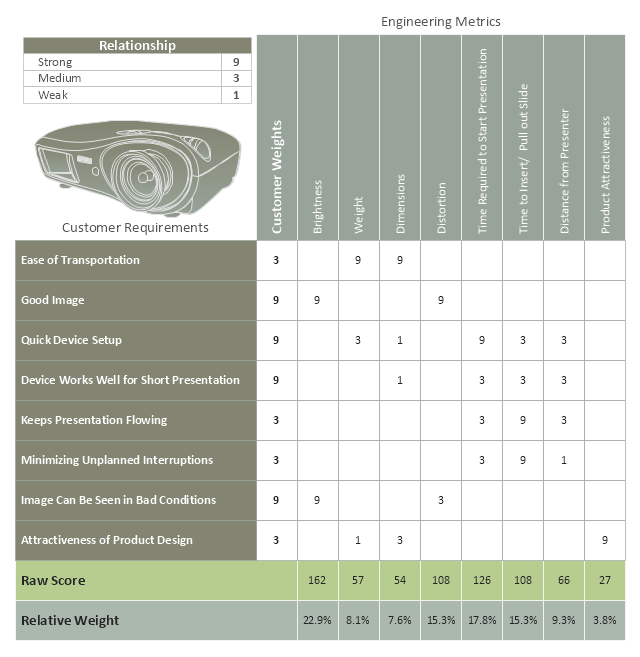
"Quality function deployment (QFD) is a “method to transform user demands into design quality, to deploy the functions forming quality, and to deploy methods for achieving the design quality into subsystems and component parts, and ultimately to specific elements of the manufacturing process.”, as described by Dr. Yoji Akao, ... when the author combined his work in quality assurance and quality control points with function deployment used in value engineering.
QFD is designed to help planners focus on characteristics of a new or existing product or service from the viewpoints of market segments, company, or technology-development needs. The technique yields charts and matrices.
QFD helps transform customer needs (the voice of the customer [VOC]) into engineering characteristics (and appropriate test methods) for a product or service, prioritizing each product or service characteristic while simultaneously setting development targets for product or service." [Quality function deployment. Wikipedia]
This quality function deployment (QFD) matrix chart example was created using the ConceptDraw PRO diagramming and vector drawing software extended with the Matrices solution from the Marketing area of ConceptDraw Solution Park.
QFD
 Matrices
This solution extends ConceptDraw DIAGRAM software with samples, templates and library of design elements for drawing the business matrix diagrams.
Bar Diagrams for Problem Solving. Create economics and financial bar charts with Bar Graphs Solution

SWOT Analysis Tool for Small Business

What is SWOT Analysis in Marketing

SWOT matrix template

Work Order Process Flowchart. Business Process Mapping Examples

- Pie Chart Software | Marketing Analysis Diagram | Flowchart ...
- Flowchart Example: Flow Chart of Marketing Analysis | Good Flow ...
- Circle-spoke diagram template - Target market | Pie Chart Examples ...
- Flowchart Example: Flow Chart of Marketing Analysis | Marketing ...
- Circle-spoke diagram template - Target market | Marketing ...
- Marketing Diagrams | Pyramid Chart Examples | Circle-spoke ...
- Create Graphs and Charts | Line Graph Charting Software | Marketing |
- Circle-spoke diagram template - Target market | Arrow circle chart ...
- Arrow circle chart template | Pie Chart Examples | Circle-spoke ...
- Circle-spoke diagram template
- Pyramid Chart Examples | Service-goods continuum diagram ...
- Pyramid Diagram and Pyramid Chart | Pyramid Chart Examples ...
- Marketing | Circle-spoke diagram template - Target market ...
- Arrow circle chart template | Circle-spoke diagram template - Target ...
- Pyramid Chart Examples | Flowchart Example: Flow Chart of ...
- Marketing Analysis Diagram | Flowchart Example: Flow Chart of ...
- Pyramid Chart Examples | Concept map - Internet marketing ...
- Flowchart Example: Flow Chart of Marketing Analysis | How to ...
- Picture Graphs | Marketing Analysis Diagram | Flowchart Example ...
- Marketing | Target and Circular Diagrams | Target market - Onion ...