Circle Spoke Diagram Template

Circular Flow Diagram Template

2 Circle Venn Diagram. Venn Diagram Example

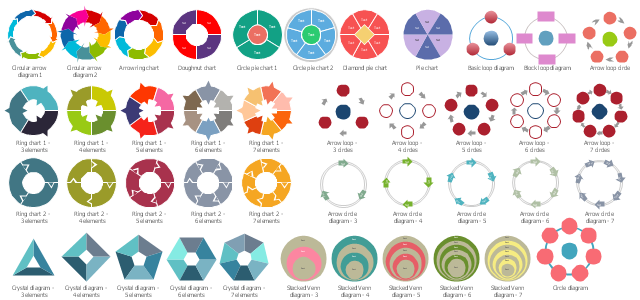
The vector stencils library "Circular diagrams" contains 42 templates of circular diagrams: circular arrow diagram, circular motion diagram, arrow ring chart, doughnut chart (donut chart), circle pie chart, diamond pie chart, circle diagram, pie chart, ring chart, loop diagram, block loop diagram, arrow loop circle, crystal diagram, triangular diagram, diamond diagram, pentagon diagram, hexagon diagram, heptagon diagram, cycle diagram (cycle chart), stacked Venn diagram (onion diagram), arrow circle diagram.
The example of marketing diagrams templates "Design elements - Circular diagrams" for the ConceptDraw PRO diagramming and vector drawing software is included the Target and Circular Diagrams solution from the Marketing area of ConceptDraw Solution Park.
www.conceptdraw.com/ solution-park/ marketing-target-and-circular-diagrams
Circular diagrams templates
3 Circle Venn. Venn Diagram Example

Circles Venn Diagram

Use this template of arrow circle chart (circle arrow diagram, segmented cycle diagram) in the ConceptDraw PRO diagramming and vector drawing software to visualize progression or continuing sequence of stages, tasks or events as circular flow.
The template "Arrow circle chart" is included in the Pie Charts solution of the Graphs and Charts area in ConceptDraw Solution Park.
The template "Arrow circle chart" is included in the Pie Charts solution of the Graphs and Charts area in ConceptDraw Solution Park.
Donut chart
3 Circle Venn Diagram. Venn Diagram Example

What Is a Circle Spoke Diagram

Circle Diagrams

The vector stencils library "Circular arrows diagrams" contains 20 templates of circular arrows diagrams and arrow donut charts.
Use these shapes to draw your circular arrows diagrams in the ConceptDraw PRO diagramming and vector drawing software.
The vector stencils library "Circular arrows diagrams" is included in the Circular Arrows Diagrams solution from the area "What is a Diagram" of ConceptDraw Solution Park.
Use these shapes to draw your circular arrows diagrams in the ConceptDraw PRO diagramming and vector drawing software.
The vector stencils library "Circular arrows diagrams" is included in the Circular Arrows Diagrams solution from the area "What is a Diagram" of ConceptDraw Solution Park.
Circular arrows diagram - 3 elements

Circular arrows diagram - 4 elements

Circular arrows diagram - 5 elements

Circular arrows diagram - 6 elements

Circular arrows diagram - 7 elements

Arrows donut chart - 3 slices

Arrows donut chart - 4 slices

Arrows donut chart - 5 slices

Arrows donut chart - 6 slices

Arrows donut chart - 7 slices

Ring chart - 3 elements

Ring chart - 4 elements

Ring chart - 5 elements

Ring chart - 6 elements

Ring chart - 7 elements

Arrow circle diagram - 3 elements
Arrow circle diagram - 4 elements
Arrow circle diagram - 5 elements
Arrow circle diagram - 6 elements
Arrow circle diagram - 7 elements
Target Diagram

Use this circle chart template to design your sector diagrams.
"A chart is a graphical representation of data, in which the data is represented by symbols, such as ... slices in a pie chart. ... Charts are often used to ease understanding ... the relationships between parts of the data. ... For example, data that presents percentages in different groups (such as "satisfied, not satisfied, unsure") are often displayed in a pie chart ... A pie chart shows percentage values as a slice of a pie." [Chart. Wikipedia]
The template "Sector diagram" for the ConceptDraw PRO diagramming and vector drawing software is included in the Pie Charts solution of the Graphs and Charts area in ConceptDraw Solution Park.
Circle chart

Onion Diagram Templates

Chart Templates

 Pie Charts
Pie Charts are extensively used in statistics and business for explaining data and work results, in mass media for comparison (i.e. to visualize the percentage for the parts of one total), and in many other fields. The Pie Charts solution for ConceptDraw DIAGRAM offers powerful drawing tools, varied templates, samples, and a library of vector stencils for simple construction and design of Pie Charts, Donut Chart, and Pie Graph Worksheets.
The vector stencils library "Circular diagrams" contains 42 templates of circular diagrams: circular arrow diagram, circular motion diagram, arrow ring chart, doughnut chart (donut chart), circle pie chart, diamond pie chart, circle diagram, pie chart, ring chart, loop diagram, block loop diagram, arrow loop circle, crystal diagram, triangular diagram, diamond diagram, pentagon diagram, hexagon diagram, heptagon diagram, cycle diagram (cycle chart), stacked Venn diagram (onion diagram), arrow circle diagram.
Use these shapes to illustrate your marketing and sales documents, presentations, webpages and infographics in the ConceptDraw PRO diagramming and vector drawing software extended with the Target and Circular Diagrams solution from the Marketing area of ConceptDraw Solution Park.
www.conceptdraw.com/ solution-park/ marketing-target-and-circular-diagrams
Circular arrow diagram 1
Circular arrow diagram 2
Arrow ring chart
Doughnut chart

Diamond pie chart

Pie chart

Circle diagram

Circle pie chart 2

Circle pie chart 1

Ring chart 1 - 3 elements

Ring chart 1 - 4 elements

Ring chart 1 - 5 elements

Ring chart 1 - 6 elements

Ring chart 1 - 7 elements

Ring chart 2 - 3 elements

Ring chart 2 - 4 elements

Ring chart 2 - 5 elements

Ring chart 2 - 6 elements

Ring chart 2 - 7 elements

Crystal diagram - 3 elements

Crystal diagram - 4 elements

Crystal diagram - 5 elements

Crystal diagram - 6 elements

Crystal diagram - 7 elements

Stacked Venn diagram - 4

Stacked Venn diagram - 5

Stacked Venn diagram - 6

Stacked Venn diagram - 7

Basic loop diagram

Block loop diagram

Arrow loop circle
Arrow loop - 3 circles
Arrow loop - 4 circles
Arrow loop - 5 circles
Arrow loop - 6 circles
Arrow loop - 7 circles
Arrow circle diagram - 3
Arrow circle diagram - 4
Stacked Venn diagram - 3

Arrow circle diagram - 5
Arrow circle diagram - 6
Arrow circle diagram - 7
The vector stencils library "Circular arrows diagrams" contains 20 templates of circular arrows diagrams, arrow donut charts and arrow circle diagrams for the ConceptDraw PRO diagramming and vector drawing software.
Circular Arrows Diagrams (Segmented Cycle Diagrams) visualize a sequence of steps, tasks, or events as a circular flow. They are used to visualize a processing cycle in marketing and management documents and presentations.
The example "Design elements - Circular arrows diagrams" is included in the Circular Arrows Diagrams solution from the area "What is a Diagram" of ConceptDraw Solution Park.
Arrow circle diagram templates
HelpDesk
How to Add a Circle-spoke Diagram to PowerPoint

Donut Chart

- Circular Diagram Visio Templates
- Circular Arrows Diagrams | Arrow circle chart - Template | How to ...
- Circular Flow Diagram Template
- Circle Spoke Diagram Template | Circle Diagrams | 2 Circle Venn ...
- Emergency management exercise cycle | How to Draw a Circular ...
- Arrow circle chart - Template | How to Draw a Circular Arrows ...
- Circle Diagrams | Circular Diagram | Best Diagramming | Circle ...
- Circle Diagrams | Circle-Spoke Diagrams | Circles Venn Diagram ...
- Circle Spoke Diagram Template | Target Diagram | Target diagrams ...
- Circle Spoke Diagram Template | Circle Diagrams | 2 Circle Venn ...
- Circular Diagram
- Circular Diagram Example
- Arrow circle chart - Template | Exploded pie chart - Template | Chart ...
- Arrow circle chart - Template
- Circle Diagrams | Research cycle - Circle diagram | How to Draw a ...
- Target and Circular Diagrams | Target Diagram | Circle Spoke ...
- Circle Spoke Diagram Template
- Circular Arrows Diagrams | Arrow circle chart - Template | Basic ...
- Circular Diagram | Target and Circular Diagrams | Circular Flow ...