"Online advertising, also called Internet advertising, uses the Internet to deliver promotional marketing messages to consumers. It includes email marketing, search engine marketing, social media marketing, many types of display advertising (including web banner advertising), and mobile advertising. Like other advertising media, online advertising frequently involves both a publisher, who integrates advertisements into its online content, and an advertiser, who provides the advertisements to be displayed on the publisher's content. Other potential participants include advertising agencies who help generate and place the ad copy, an ad server who technologically delivers the ad and tracks statistics, and advertising affiliates who do independent promotional work for the advertiser." [Online advertising. Wikipedia]
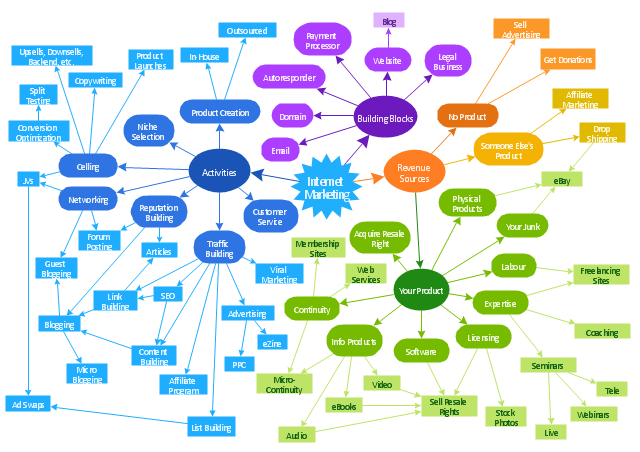
The concept map example "Internet marketing" was created using the ConceptDraw PRO diagramming and vector drawing software extended with the Concept Maps solution from the area "What is a Diagram" of ConceptDraw Solution Park.
The concept map example "Internet marketing" was created using the ConceptDraw PRO diagramming and vector drawing software extended with the Concept Maps solution from the area "What is a Diagram" of ConceptDraw Solution Park.
Concept map
Flowchart Marketing Process. Flowchart Examples

What Is a Concept Map

This circle-spoke diagram sample illustrates the target market concept.
"A target market is a group of customers towards which a business has decided to aim its marketing efforts and ultimately its merchandise. A well-defined target market is the first element to a marketing strategy. The marketing mix variables of product, place (distribution), promotion and price are the four elements of a marketing mix strategy that determine the success of a product in the marketplace." [Target market. Wikipedia]
The hub-and-spoke diagram example "Target market" was created using the ConceptDraw PRO diagramming and vector drawing software extended with the Circle-Spoke Diagrams solution from the area "What is a Diagram" of ConceptDraw Solution Park.
Circle-spoke diagram

Concept Maps

Marketing Sales Funnel Examples

 Marketing Diagrams
Marketing Diagrams solution extends ConceptDraw DIAGRAM diagramming software with abundance of samples, templates and vector design elements intended for easy graphical visualization and drawing different types of Marketing diagrams and graphs, including Branding Strategies Diagram, Five Forces Model Diagram, Decision Tree Diagram, Puzzle Diagram, Step Diagram, Process Chart, Strategy Map, Funnel Diagram, Value Chain Diagram, Ladder of Customer Loyalty Diagram, Leaky Bucket Diagram, Promotional Mix Diagram, Service-Goods Continuum Diagram, Six Markets Model Diagram, Sources of Customer Satisfaction Diagram, etc. Analyze effectively the marketing activity of your company and apply the optimal marketing methods with ConceptDraw DIAGRAM software.
Concept Map

Basic Audit Flowchart. Flowchart Examples

 Concept Maps
The technique of concept mapping was developed as a constructive way of representing knowledge in science and increasing the meaningfulness of learning. Now, the creation of a concept map is extremely helpful when used in education as learning and teaching techniques that assist memorization. Concept maps are also used for idea generation in brainstorming sessions, and for detailing the structure of complex ideas.
Examples of Flowcharts, Org Charts and More


Gantt chart examples

Flowchart of Products. Flowchart Examples

Example Basic Flowchart. Flowchart Examples

Linux Audit Flowchart Example. Flowchart Examples

Copying Service Process Flowchart. Flowchart Examples

Marketing and Sales Organization chart. Organization chart Example

Check Order Process Flowchart. Flowchart Examples

Sample Project Flowchart. Flowchart Examples


Account Flowchart. Flowchart Examples

- Examples Of Marketing Concepts
- Line Chart Examples | Diagram For The Societal Marketing Concept
- Internet marketing - Concept map | Leaky bucket diagram | Concept ...
- What Is a Concept Map | Flowchart Marketing Process. Flowchart ...
- Flowchart Marketing Process. Flowchart Examples | Process ...
- Marketing Concept With Graph
- Leaky bucket diagram | Internet marketing - Concept map | How to ...
- Societal Marketing Concept Diagram
- Marketing Concepts
- Concept Maps | Internet marketing - Concept map | Concept Maps ...
- Internet marketing - Concept map | Design elements - Marketing ...
- How to Draw a Circular Arrows Diagram Using ConceptDraw PRO ...
- Internet marketing - Concept map | Concept Maps | What Is a ...
- Marketing Concepts Flow Chart
- What Is a Concept Map | Internet marketing - Concept map | Concept ...
- Internet Marketing Infographic | Internet marketing professions ...
- Marketing Concept
- Internet marketing - Concept map | Internet solutions with ...
- Marketing | Competitor Analysis | Swot Analysis Examples | Concept ...