What Is a Concept Map

Flowchart Marketing Process. Flowchart Examples

Concept Maps

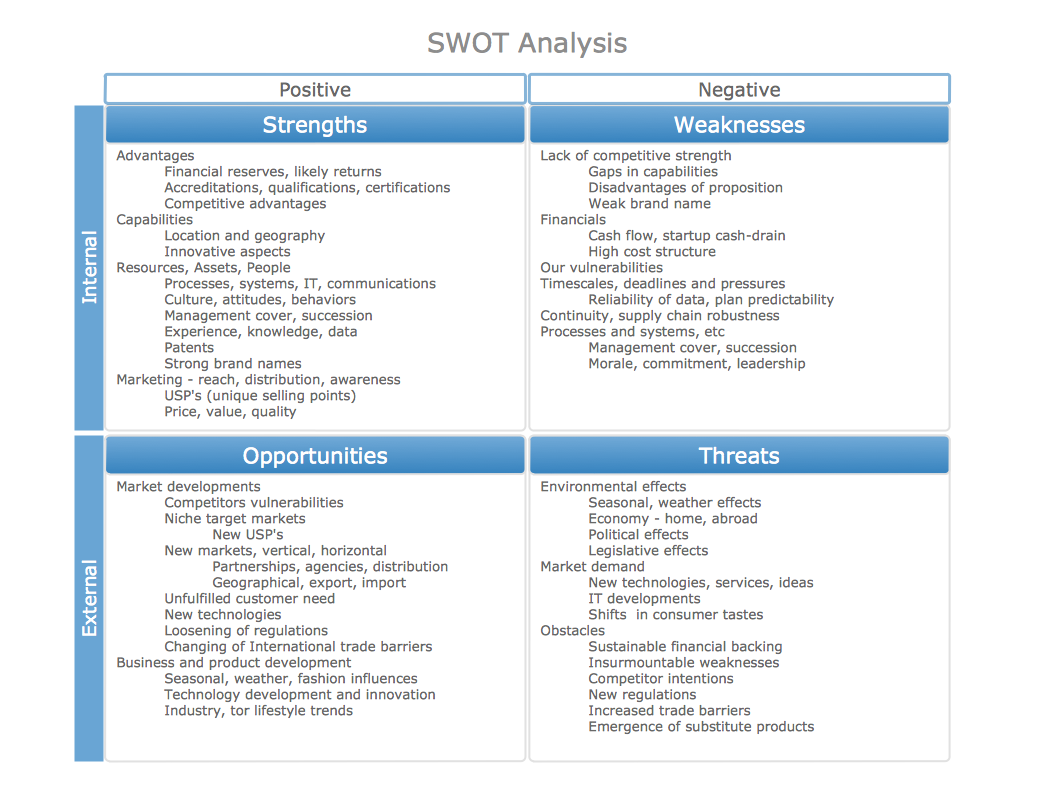
 SWOT Analysis
SWOT and TOWS Matrix Diagrams solution extends ConceptDraw DIAGRAM and ConceptDraw MINDMAP software with features, templates, samples and libraries of vector stencils for drawing SWOT and TOWS analysis matrices and mind maps.
 ConceptDraw Solution Park
ConceptDraw Solution Park collects graphic extensions, examples and learning materials
HelpDesk
How to Draw a Circular Arrows Diagram

 Concept Maps
The technique of concept mapping was developed as a constructive way of representing knowledge in science and increasing the meaningfulness of learning. Now, the creation of a concept map is extremely helpful when used in education as learning and teaching techniques that assist memorization. Concept maps are also used for idea generation in brainstorming sessions, and for detailing the structure of complex ideas.
 Venn Diagrams
Venn Diagrams are actively used to illustrate simple set relationships in set theory and probability theory, logic and statistics, mathematics and computer science, linguistics, sociology, and marketing. Venn Diagrams are also often used to visually summarize the status and future viability of a project.
 Matrices
This solution extends ConceptDraw DIAGRAM software with samples, templates and library of design elements for drawing the business matrix diagrams.
HelpDesk
How to Create a Concept Map

 Target and Circular Diagrams
This solution extends ConceptDraw DIAGRAM software with samples, templates and library of design elements for drawing the Target and Circular Diagrams.
 Marketing Diagrams
Marketing Diagrams solution extends ConceptDraw DIAGRAM diagramming software with abundance of samples, templates and vector design elements intended for easy graphical visualization and drawing different types of Marketing diagrams and graphs, including Branding Strategies Diagram, Five Forces Model Diagram, Decision Tree Diagram, Puzzle Diagram, Step Diagram, Process Chart, Strategy Map, Funnel Diagram, Value Chain Diagram, Ladder of Customer Loyalty Diagram, Leaky Bucket Diagram, Promotional Mix Diagram, Service-Goods Continuum Diagram, Six Markets Model Diagram, Sources of Customer Satisfaction Diagram, etc. Analyze effectively the marketing activity of your company and apply the optimal marketing methods with ConceptDraw DIAGRAM software.
Examples of Flowcharts, Org Charts and More


SWOT Analysis matrix templates and samples
 Circle-Spoke Diagrams
Examples of subject areas that are well suited to this approach are marketing, business, products promotion, process modeling, market, resource, time, and cost analysis. Circle-Spoke Diagrams are successfully used in presentations, conferences, management documents, magazines, reportages, reviews, reports, TV, and social media.
- Marketing Concept Examples
- Examples Of Marketing Concept
- Internet marketing - Concept map | Concept Maps | What Is a ...
- Internet marketing - Concept map | Marketing - Vector stencils library ...
- Internet marketing - Concept map
- Flowchart Marketing Process. Flowchart Examples | ConceptDraw ...
- Flowchart Marketing Process. Flowchart Examples | Marketing ...
- Marketing - Vector stencils library | Internet marketing - Concept map ...
- Flowchart Marketing Process. Flowchart Examples | Basic Flowchart ...
- Diagram Marketing Concept
- Internet marketing - Concept map | Marketing | Design elements ...
- Marketing Diagrams | Marketing plan - Circular diagram | Internet ...
- Flowchart Marketing Process. Flowchart Examples | Flowchart ...
- Conceptual Mapping Of Marketing
- Marketing Concepts Flowchart
- Marketing - Vector stencils library | Societal Marketing Concept ...
- Concept Maps | Concept Map Maker | Team psychological ...
- Internet Marketing Infographic | Internet marketing - Concept map ...
- Marketing Concept With Graph