Basic Flowchart Symbols and Meaning


Process Flowchart


 Organizational Charts
Organizational Charts solution extends ConceptDraw PRO software with samples, templates and library of vector stencils for drawing the org charts.
How to Draw Pictorial Chart. How to Use Infograms

HelpDesk
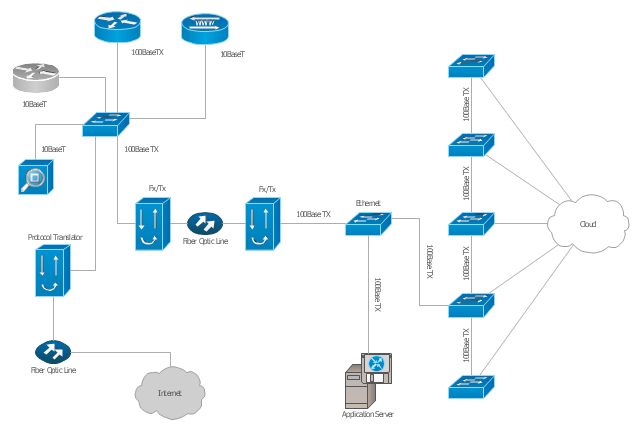
How To Convert a Computer Network Diagram to Adobe PDF

"A computer network diagram is a schematic depicting the nodes and connections amongst nodes in a computer network or, more generally, any telecommunications network. ...
Depending on whether the diagram is intended for formal or informal use, certain details may be lacking and must be determined from context. ...
At different scales diagrams may represent various levels of network granularity. At the LAN level, individual nodes may represent individual physical devices, such as hubs or file servers, while at the WAN level, individual nodes may represent entire cities. In addition, when the scope of a diagram crosses the common LAN/ MAN/ WAN boundaries, representative hypothetical devices may be depicted instead of showing all actually existing nodes." [Computer network diagram. Wikipedia]
The Cisco computer network diagram example "Network organization chart" was created using the ConceptDraw PRO diagramming and vector drawing software extended with the Cisco Network Diagrams solution from the Computer and Networks area of ConceptDraw Solution Park.
Cisco network diagram
HelpDesk
How To Create a PERT Chart

Account Flowchart. Flowchart Examples

HelpDesk
How To Add a Computer Network Diagram to a PowerPoint Presentation

Flow Chart Design - How to Design a Good Flowchart

Pictorial Chart

HelpDesk
How to Draw a Divided Bar Chart in ConceptDraw PRO

Network Drawing Software


- Cross-Functional Flowcharts | Flow Chart Of Computer Trading ...
- PM Teams | PM Easy | PM Agile | Project Chart On Computer
- Computer Network Diagrams | Draw The Classification Chart Of ...
- Computer Manufacturing Process Flow Chart
- Chart On Computer Networks
- Flow Chart Of Computer Aided Design
- Euclidean algorithm - Flowchart | Flow Chart Of Computer For Hcf ...
- Chart On Computer Modem
- How to Draw an Organization Chart | How to Draw a Computer ...
- Venn Diagram Examples for Problem Solving. Computer Science ...
- Computer Organizational Chart
- Computer Network Diagrams | How to Draw a Pie Chart Using ...
- Gantt Chart For Computer Network Project
- Computer Network Diagrams | Area Charts | Cisco Network ...
- Account Flow Chart Sample
- Flow Chart In Computer Projecj
- Computer Project For Drawing On Chart
- Flow Chart Of Computer Graphics
- Examples of Flowcharts, Org Charts and More | Using Remote ...
- Conceptdraw.com: Mind Map Software, Drawing Tools | Project ...