HelpDesk
Creating a House of Quality Diagram . ConceptDraw Helpdesk
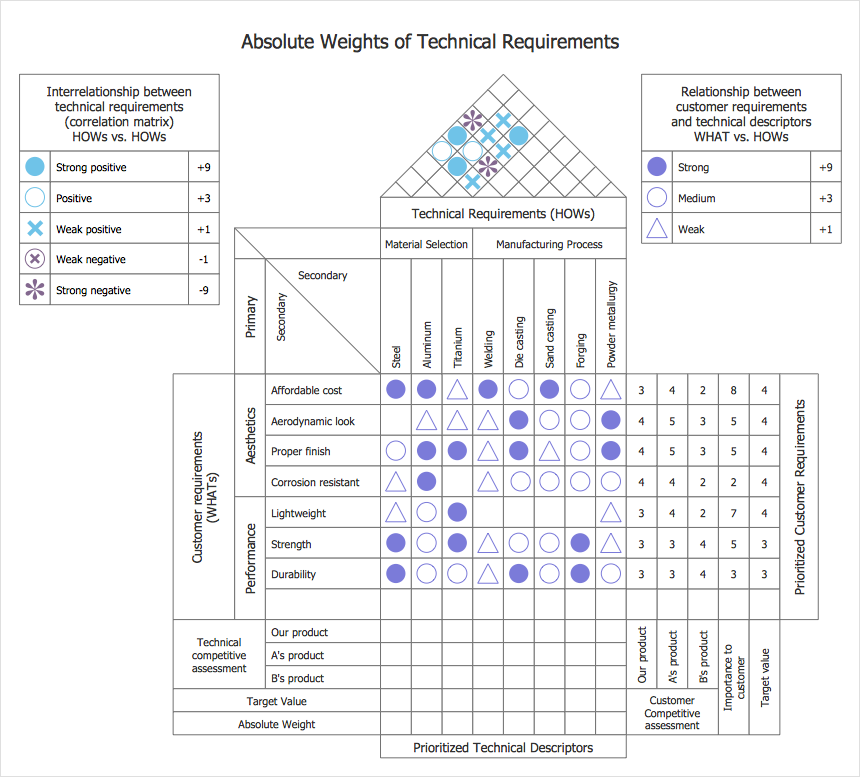
The House of Quality diagram is a part of quality function deployment method ( QFD) designed by Japanese planning specialists to help turn customerOrganizational Structure Total Quality Management. Total Quality
Organizational Structure Total Quality ManagementTime, Quality , Money Triangle Diagram
Pyramid Diagrams. Time quality money triangle diagramTotal Quality Management Business Diagram . Total Quality
Fishbone diagram - Causes of low quality outputTQM Diagram Tool. Total Quality Management Diagram Software
Quality fishbone diagram template
 Total Quality Management Diagrams Solution. ConceptDraw.com
Total Quality Management Diagrams solution extends ConceptDraw DIAGRAM
software with samples, templates and vector stencils library for drawing the TQM
Definition TQM Diagram . Total Quality Management Diagram
Business process - TQM diagram
 Seven Basic Tools of Quality Solution. ConceptDraw.com
Manage quality control in the workplace, using fishbone diagrams , flowcharts,
Pareto charts and histograms, provided by the Seven Basic Tools of Quality
TQM Diagram Example. Total Quality Management Diagram Software
Import process flowchartSeven Basic Tools of Quality - Fishbone Diagram
Seven Basic Tools of Quality - Fishbone DiagramThe Fifty Two Elements of TQM. Total Quality Management Diagram
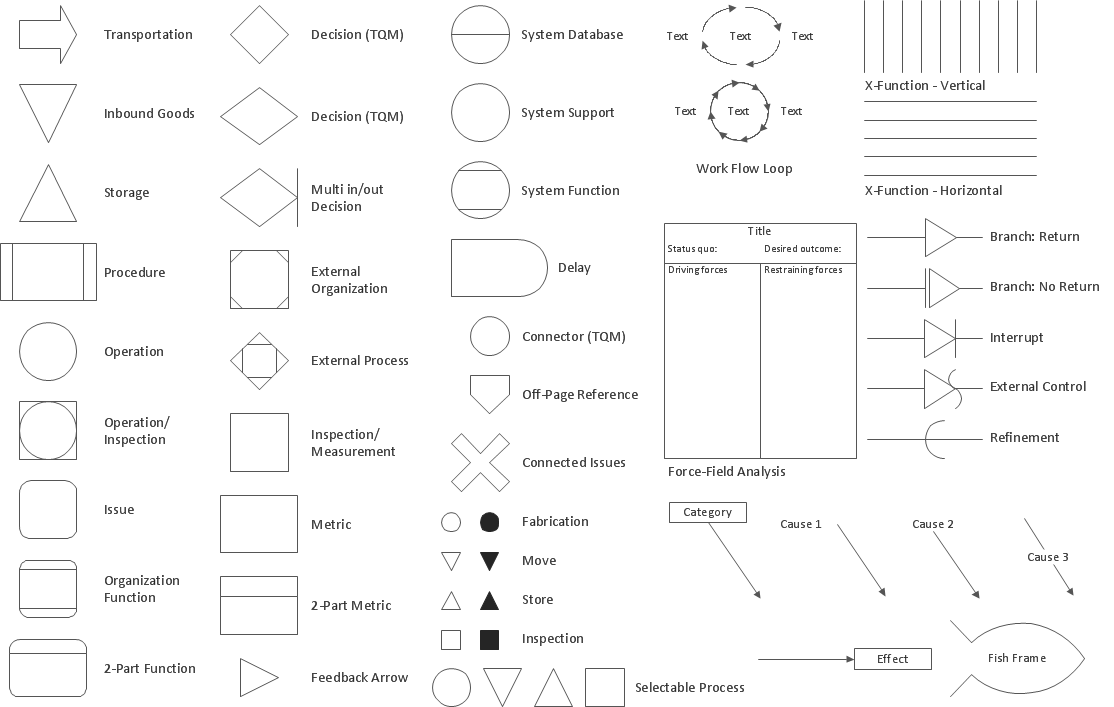
Design elements of TQM diagramsTQM Software – Build Professional TQM Diagrams . Total Quality
HR management process flowchart
 House of Quality Solution. ConceptDraw.com
House of Quality solution extends the ConceptDraw DIAGRAM software with
powerful drawing tools, numerous specific samples and examples, and set of
vector
Quality Engineering Diagrams . Value Stream Mapping Software
Quality Engineering Diagrams - Value stream mapping (VSM) sample- Fishbone diagram - Causes of low- quality output | Fishbone ...
- Fishbone Diagrams | Fishbone diagram - Causes of low- quality ...
- Quality Management System | Process Flowchart | Identifying Quality ...
- Block Diagram Of Quality Control
- Process Flowchart | TQM Diagram Example | Definition TQM ...
- Total Quality Management Value | Fishbone Diagram | 4ms Of ...
- Fishbone Diagrams | Total Quality Management with ConceptDraw ...
- Definition TQM Diagram | TQM Diagram Example | TQM diagram ...
- Management Tools — Total Quality Management | Identifying ...
- Total Quality Management TQM Diagrams
- How to Create a House of Quality Diagram | House of Quality ...
- What Is The 4ms Of Total Quality Management
- How to Create a House of Quality Diagram | House of quality 9 step ...
- Quality Control | Value-Stream Mapping for Manufacturing | TQM ...
- Quality Diagram Symbols And Meanings Pdf
- Total Quality Management Value | Manufacturing 8 Ms fishbone ...
- Fishbone Diagrams | Fish Bone Diagram In Quality Management
- TQM Diagram Tool | Picture Graphs | Seven Basic Tools of Quality ...
- Process Flowchart | Quality Control Chart Software — ISO ...
- Fishbone diagram - Causes of low- quality output | Total Quality ...
- ERD | Entity Relationship Diagrams, ERD Software for Mac and Win
- Flowchart | Basic Flowchart Symbols and Meaning
- Flowchart | Flowchart Design - Symbols, Shapes, Stencils and Icons
- Flowchart | Flow Chart Symbols
- Electrical | Electrical Drawing - Wiring and Circuits Schematics
- Flowchart | Common Flowchart Symbols
- Flowchart | Common Flowchart Symbols


