Process Flow app for Mac . Free Trial for Mac & PC. Business
Flowchart - Selection sorting methodCreate Flow Chart on Mac . Business Process Modeling Tool
To be able to analyze, design, document, manage, represent, visualize and understand the complex processes of some working system and to systematize its work, you need to create diagram to make sure everything works very well and its elements are there where they should be, in its places. Flowchart is one of the types of diagram which allows to represent a process, as well as workflow and algorithm in a way of boxes connected by the arrows. To be able to draw flowchart in a very short period of time, you can use our samples as well as many libraries full of design elements which you can find in ConceptDraw STORE and ConceptDraw DIAGRAM will appear to be your best assistant and counselor as it is very simple to use, and having these examples will definitely simplify your work and so your life. Try the genius software on your Mac and make sure you will not be disappointed, but you’ll recommend it to all of your friends, colleagues and partners.How to Draw an Effective Flowchart . Free Trial for Mac & PC
Flowchart - Stages of personnel certificationHow To Create a Flow Chart in ConceptDraw. Free Trial for Mac
Flow chart - HR management processUse the Best FlowChart Tool for the Job. Free Trial for Mac & PC
Flowchart - Product life cycle processProject Management Software Tool
Critical path in ConceptDraw PROJECT. ConceptDraw PROJECT is excellent simple project management software for solving common project managent tasks.How To Create a FlowChart using ConceptDraw. Free Trial for Mac
How To Create a FlowChart using ConceptDrawBest Flowcharts. Free Trial for Mac & PC. Business Process
Flowchart - HR management processWorkflow Diagram Software Mac . Features to Draw Diagrams
Workflow Diagram Software Mac OS XVisual Presentations Made Easy with Diagramming Software . Draw
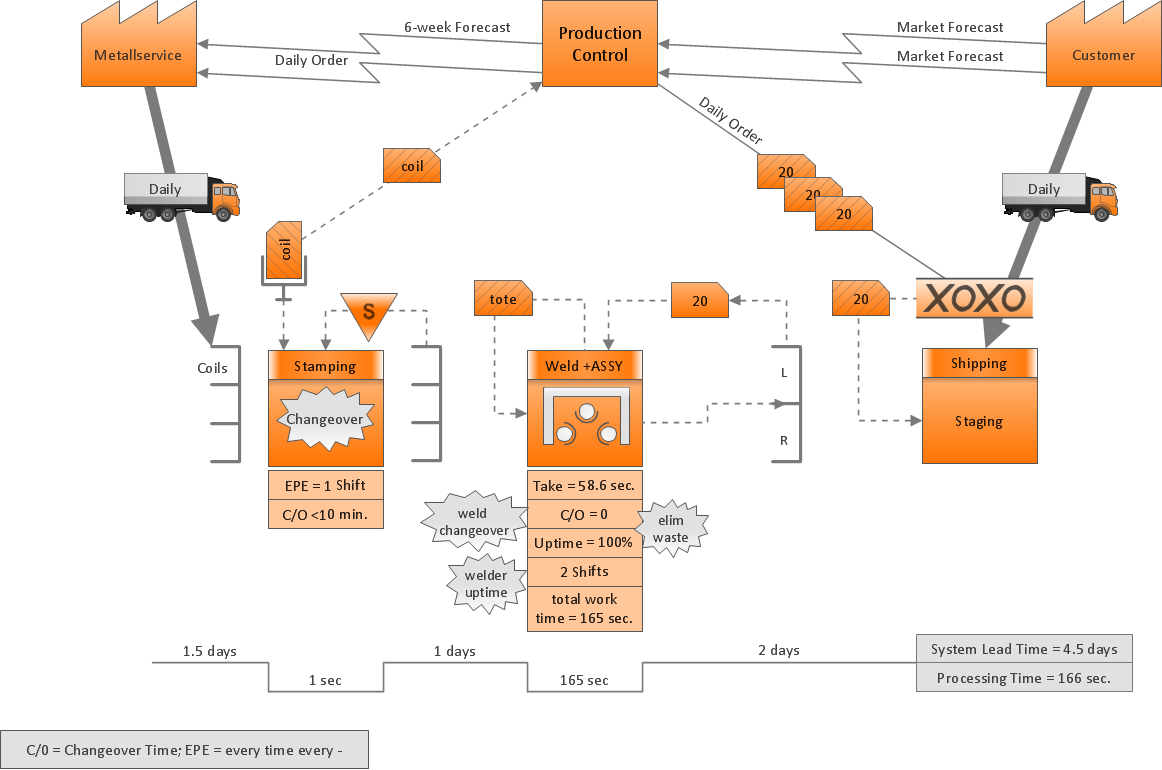
Flowchart - HR management processLean Manufacturing Diagrams. Value Stream Mapping Software
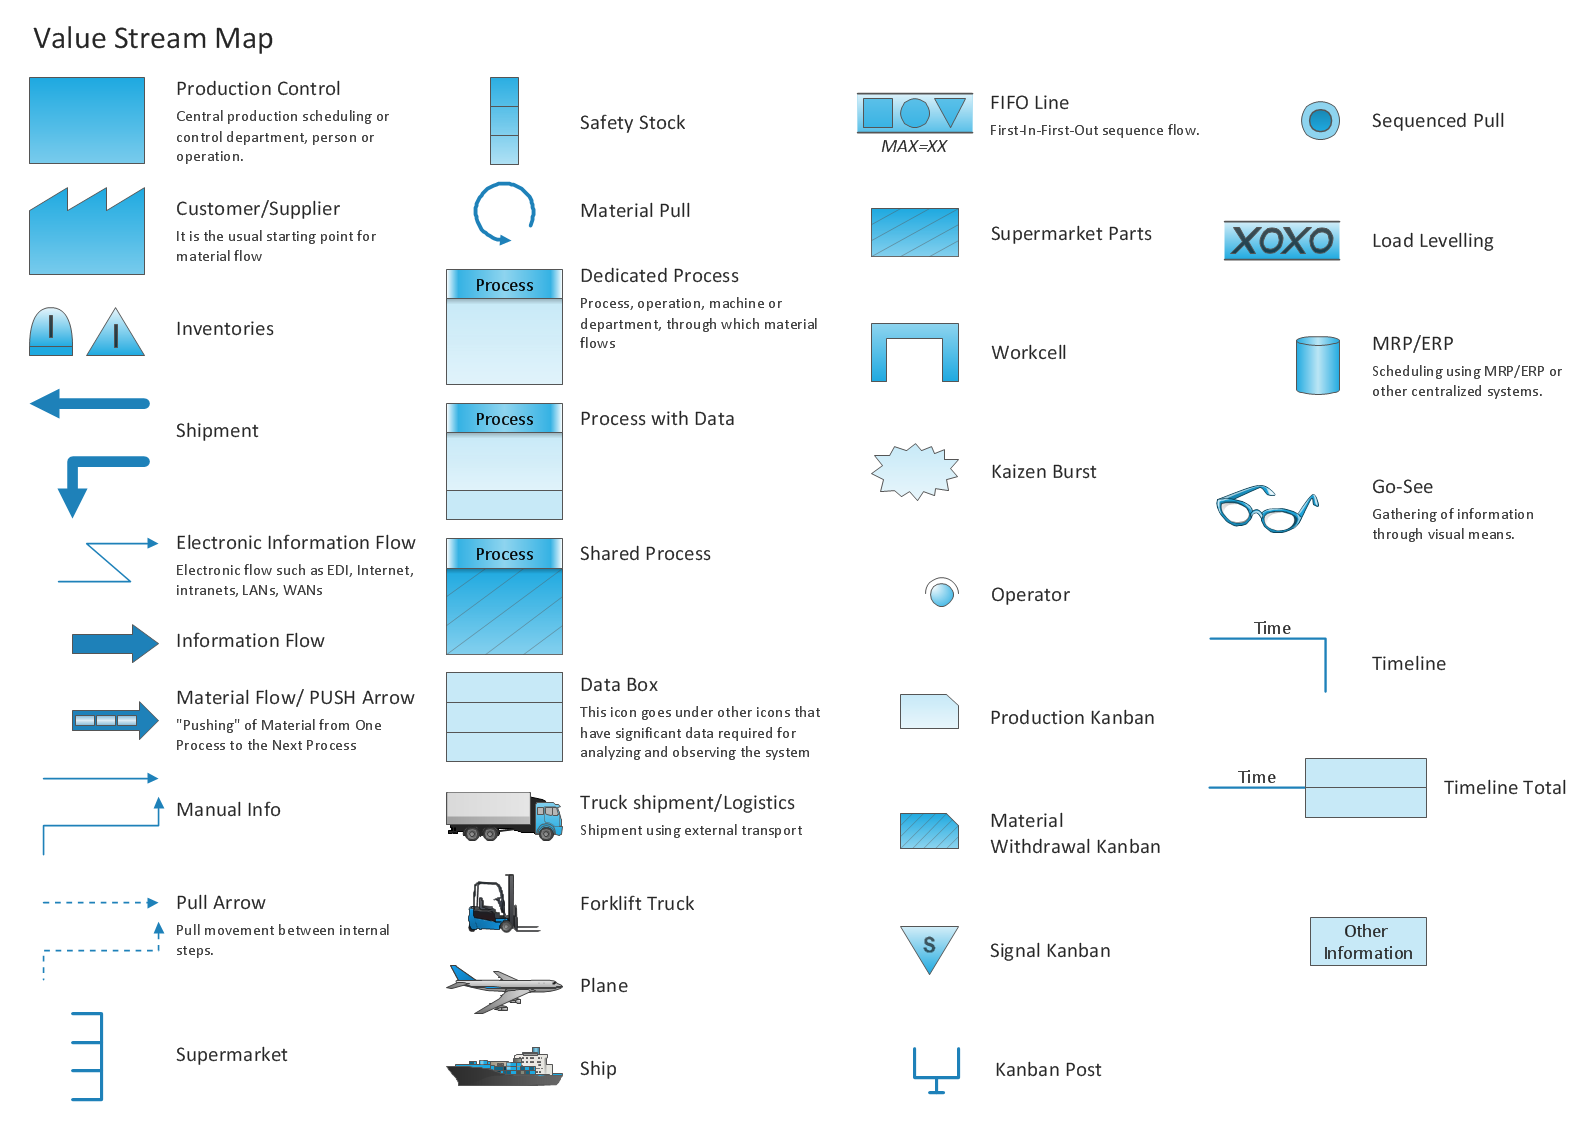
Value stream mapping (VSM) design elementsBest Program to Make Flow Chart Diagrams. Create Flowcharts
Cross-functional flowchart exampleSending a Presentation via Skype for Mac OS X. Crossplatform
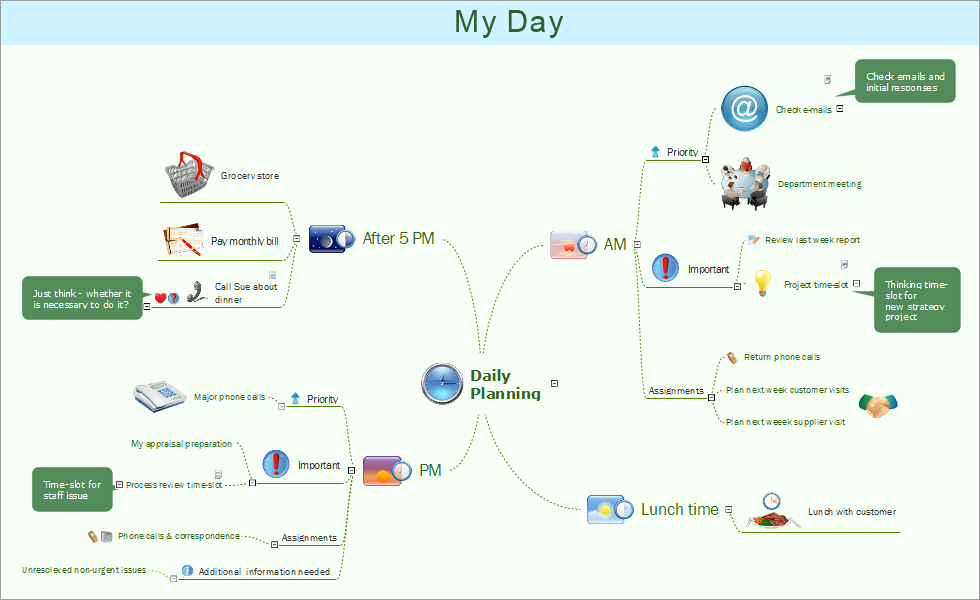
Mind map example - Daily planning - ConceptDraw Remote Presentation for Skype solutionFundamental Tool in Quality Management . The best Quality Mind
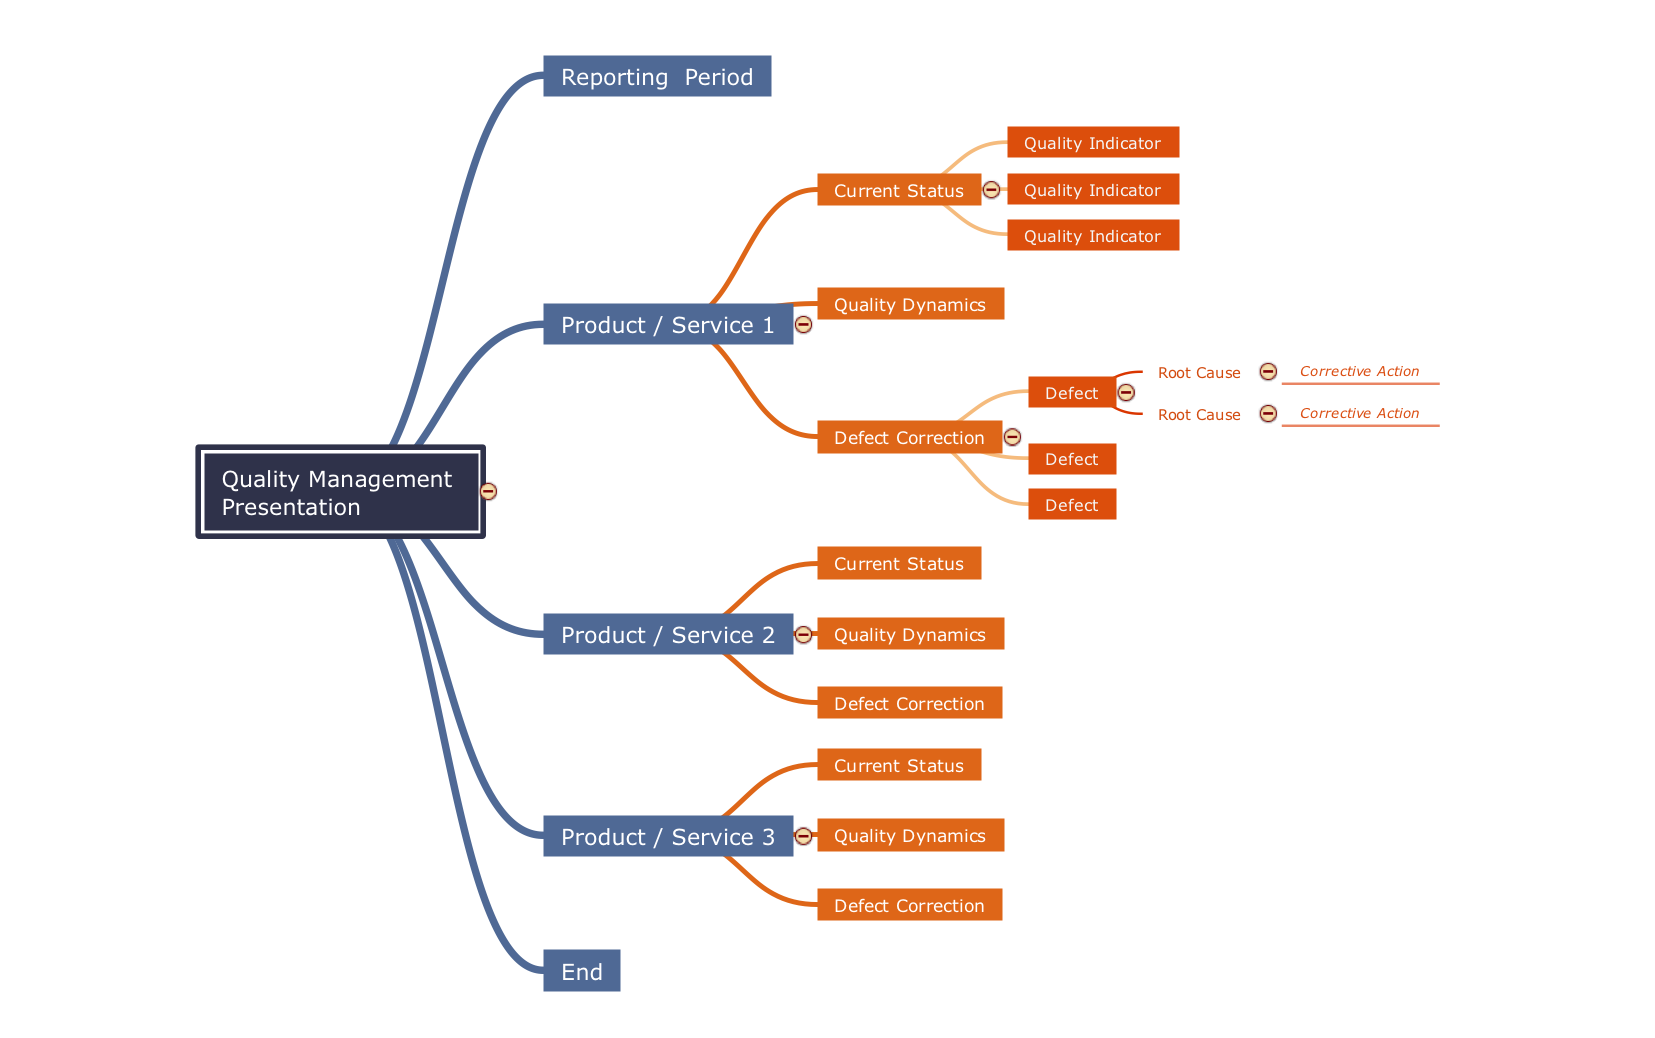
Mind map template - Quality management presentationMap Infographic Tool . Data Visualization. Spatial infographics
Conference centre location map - Spatial infographicsER Diagram Software - ConceptDraw for Mac & PC. Draw entity
Showing the connections between databases and structures you might need to draw a chart ad the best one in this case would be the Entity-Relationship Diagram (ERD) which usually looks like a number of blocks displaying the relationships that can be many-to-many, one-to-many or one-to-one. ERD is also very popular in many different businesses for describing some company’s structure or some business’s processes. Its layouts can be found in ConceptDraw STORE or in Solution Park on this site as well as the description of making it step by step to make it easier for you to start making it yourself and to learn about the best software for creating the charts. Try the ConceptDraw DIAGRAM now and find out how simple it is to review, modify and convert any of the ready-to-use diagrams as well as the flowcharts from this application to any of these formats: MS PowerPoint, PDF file, MS Visio and many other graphic ones. Our software is here to help you and to simplify your work and your tasks.- Management Process Mapping Software Free Mac
- Process Mapping Template Free Download Mac
- Process Flowchart | Business Process Mapping — How to Map a ...
- Business Process Modeling Software for Mac | Flow Diagram ...
- Free Business Process Modeler For Mac
- Basic Flowchart Symbols and Meaning | Process Flowchart | Swim ...
- How To Create a MS Visio Business Process Diagram | Basic ...
- Process Flowchart | Payroll process - Swim lane process mapping ...
- Good Flow Chart app for Mac | Process Flow app for macOS ...
- Cross-Functional Flowchart (Swim Lanes) | Swim Lane Diagrams ...
- Process Flow app for macOS | Good Flow Chart app for Mac | Flow ...
- Relationship Mapping Software Mac
- Cross-Functional Flowcharts | Cross-Functional Process Map ...
- Total Quality Management Definition | Process Flowchart | Block ...
- Chemical Engineering Process Flow Diagram Software Free
- Logistics Flow Charts | Process Flowchart | How to Make a Logistics ...
- Software Work Flow Process in Project Management with Diagram ...
- Process Flowchart | Basic Flowchart Symbols and Meaning ...
- Human Resources | Basic Flowchart Symbols and Meaning | Human ...
- Business Processes | Process Flowchart | How to Design an ...
- ERD | Entity Relationship Diagrams, ERD Software for Mac and Win
- Flowchart | Basic Flowchart Symbols and Meaning
- Flowchart | Flowchart Design - Symbols, Shapes, Stencils and Icons
- Flowchart | Flow Chart Symbols
- Electrical | Electrical Drawing - Wiring and Circuits Schematics
- Flowchart | Common Flowchart Symbols
- Flowchart | Common Flowchart Symbols


