Scatter Graph Charting Software
ConceptDraw provides some interactive xy chart and scatter graph symbols that offers advanced features yet is simple to use.Line Graph Charting Software
To design line and scatter charts use ConceptDraw DIAGRAM diagramming and vector drawing software extended with Line Graphs solution from Graphs and Charts area of ConceptDraw DIAGRAM Solution Park. (Line chart, scatter chart, 2d chart).Scatter Chart Examples
The Line Graphs solution from Graphs and Charts area of ConceptDraw Solution Park contains a set of examples, templates and design elements library of scatter charts.Use it to draw scatter graphs using ConceptDraw DIAGRAM diagramming and vector drawing software for illustrating your documents, presentations and websites.
Scatter Graph
You've got to draw the Scatter Graph and look for the convenient tool which will help you? Direct your attention on the ConceptDraw DIAGRAM diagramming and vector drawing software extended with Scatter Diagrams Solution from the Graphs and Charts Area.Scatter Diagram
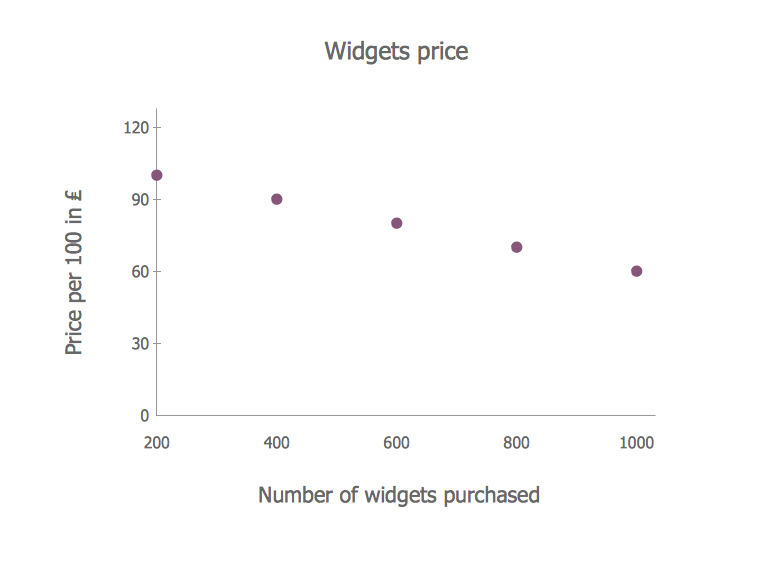
This sample shows the scatter diagram that displays the inverse correlation. The correlation measures the strength of association among two variables. You can see that when the number of widgets increases, the price per 100 widgets decreases.Using the ready-to-use objects from the Line Graphs Solution for ConceptDraw DIAGRAM you can create your own professional looking Scatter Charts quick and easy.
Chart Software for Better Presentations
Easy charting software comes with beautiful chart templates and examples. This makes it easy to create professional charts without prior experience.Graphs and Charts Area provide a wide collection of professional looking predesigned templates, samples and ready-to-use vector stencils that will help you to draw the charts and diagrams of various types: Pie Charts, Donut Charts, Line Charts, Column Charts, Bar Charts, Pyramids, Scatter Charts, Venn Diagrams, Spider Charts, Area Charts, Divided Bar Graphs.
Basic Diagramming
Create flowcharts, organizational charts, bar charts, line graphs, and more with ConceptDraw DIAGRAM.
Spider Chart Template
This sample shows the Spider Chart that represents the budget and spending for one organization and allows to compare them. The multivariate data are represented on the Spider Chart as a two-dimensional chart with four or more variables displayed on the axes that start in one point. The Spider Charts are used in the management, business and sport.Bar Chart Software
The best bar chart software ever is ConceptDraw. ConceptDraw bar chart software provides an interactive bar charting tool and complete set of predesigned bar chart objects.Scatter Plot Graph
ConceptDraw DIAGRAM extended with Scatter Diagrams solution is the best diagramming and vector drawing software for quick and easy designing the Scatter Plot Graph of any complexity.Chart Templates
Easy charting software comes with beautiful chart templates and examples. This makes it easy to create professional charts without prior experience.What Is a Picture Graph?
What is a Picture Graph? It's one of the most useful way which allows explain the information, statistical data in a visual form using the pictures. ConceptDraw DIAGRAM extended with Picture Graphs solution from the Graphs and Charts area offers you the easiest way of Picture Graphs drawing.Basic Diagramming Flowchart Software
ConceptDraw DIAGRAM is a powerful intelligent vector graphics tool for drawing flowcharts.Pie Graph Worksheets
Pie Graph is very popular kind of charts which is widely used in various fields of science and life activities. ConceptDraw DIAGRAM extended with Pie Charts Solution from the Graphs and Charts area is the best software for drawing the Pie Graph Worksheets.Stacked Graph
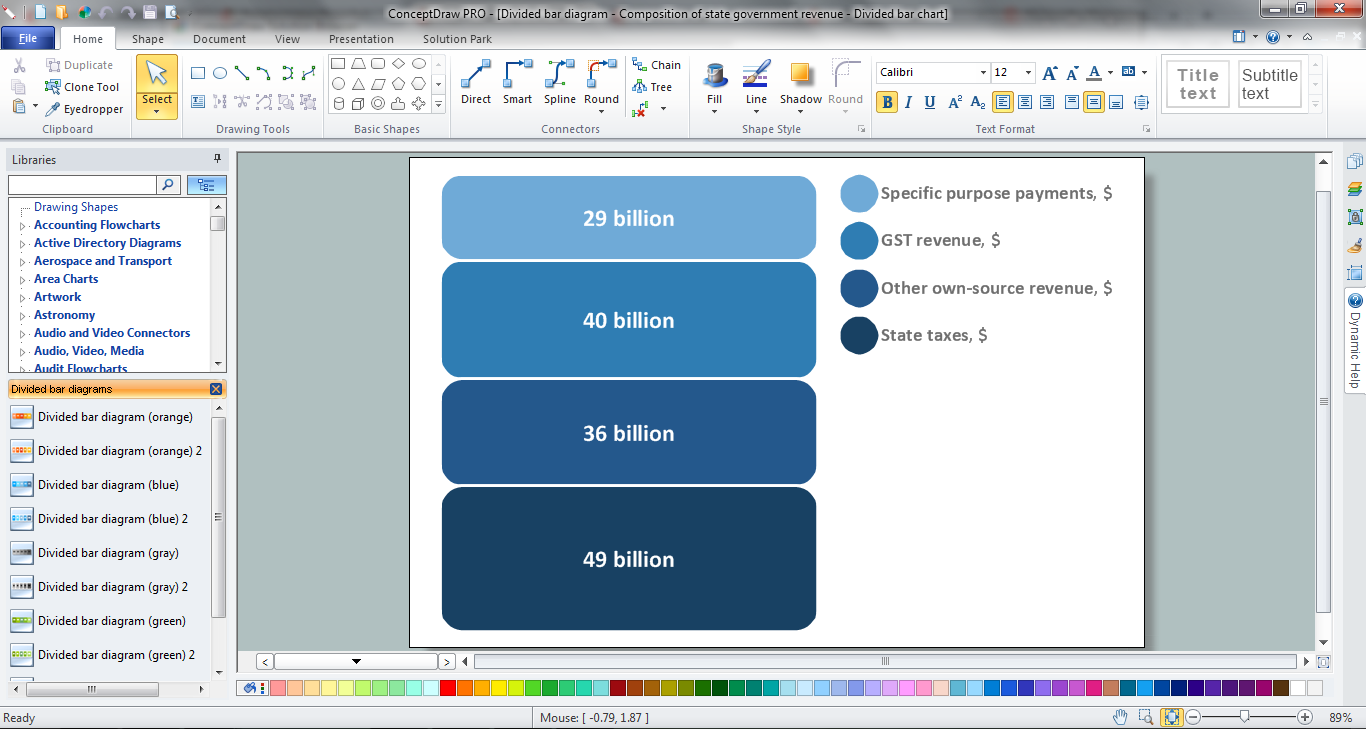
ConceptDraw DIAGRAM is a powerful software for drawing professional looking Stacked Graph thanks to the Divided Bar Diagrams solution from the Graphs and Charts area of ConceptDraw Solution Park.Bar Chart Template for Word
All these bar chart templates are included in the Bar Graphs solution.You can quickly rework these bar graph templates into your own charts by simply changing displayed data, title and legend texts.
Chart Examples
Easy charting software comes with beautiful chart templates and examples. This makes it easy to create professional charts without prior experience.Create Graphs and Charts
Charting Software allows you to create diagrams, charts, graphs, flowcharts, and other business graphics. ConceptDraw DIAGRAM include simple shape drawing tools, examples, templates, and symbol libraries.Blank Scatter Plot
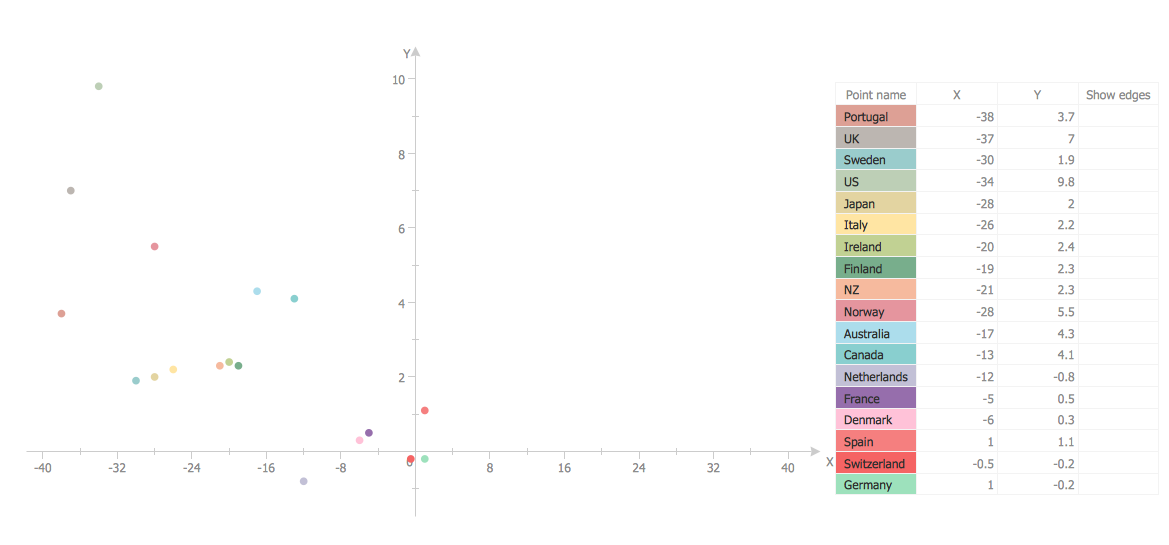
This sample shows the Scatter Plot without missing categories. It’s very important to no miss the data, because this can have the grave negative consequences. The data on the Scatter Chart are represented as points with two values of variables in the Cartesian coordinates. This sample can be used in the engineering, business, statistics, analytics, at the creating the financial and other types of reports.Chart Maker for Presentations
Easy charting software comes with beautiful chart templates and examples. This makes it easy to create professional charts without prior experience.- Scatter Graph Charting Software | Scatter Chart | Scatter Diagram ...
- Scatter Graph Charting Software | Scatter Diagrams | How to Draw a ...
- Scatter Graph Charting Software | Scatter Chart Examples | Scatter ...
- Scatter Diagrams | Blank Scatter Plot | Scatter Chart Examples ...
- Scatter Graph Charting Software | Scatter Plot Graph | Scatter Chart ...
- Scatter Diagrams | Best Diagramming | Scatter Graph | Mind Map ...
- Scatter Chart Examples | Scatter Diagrams | How to Draw a Scatter ...
- Scatter Diagrams | How to Draw a Scatter Diagram Using ...
- Business Report Pie. Pie Chart Examples | Scatter Graph Charting ...
- Scatter Graph Charting Software | Coloring Graphs | Accounting ...
- Scatter Chart Examples | Scatter Plot Graph | Scatter Graph Charting ...
- How To use House Electrical Plan Software | Scatter Graph Charting ...
- Scatter Graph Charting Software | Process Flowchart | Polar Graph ...
- Design elements - Marketing charts | Scatter Chart Examples ...
- Scatter Plot | How to Draw a Scatter Diagram | Scatter Chart ...
- Sample Pictorial Chart . Sample Infographics | Picture Graphs ...
- Basic Diagramming | Line Graph | Bar Graph | Scatter Plot On Us ...
- Scatter Diagrams | Blank Scatter Plot | How to Draw a Scatter ...
- Design elements - Scatter graphs | Scatter graphs - Vector stencils ...
- Blank Scatter Plot | Scatter Chart Examples | Scatter Plot | How To ...
- ERD | Entity Relationship Diagrams, ERD Software for Mac and Win
- Flowchart | Basic Flowchart Symbols and Meaning
- Flowchart | Flowchart Design - Symbols, Shapes, Stencils and Icons
- Flowchart | Flow Chart Symbols
- Electrical | Electrical Drawing - Wiring and Circuits Schematics
- Flowchart | Common Flowchart Symbols
- Flowchart | Common Flowchart Symbols


