This vector stencils library contains 7 templates of scatter graphs (scattergraphs, scatter charts, scatter plots, scatterplots, scatter diagrams). Use it to design your scatter graphs with ConceptDraw PRO diagramming and vector drawing software for visual analysis of correlation or dependence between two variables.
"In statistics, dependence is any statistical relationship between two random variables or two sets of data. Correlation refers to any of a broad class of statistical relationships involving dependence.
Familiar examples of dependent phenomena include the correlation between the physical statures of parents and their offspring, and the correlation between the demand for a product and its price. Correlations are useful because they can indicate a predictive relationship that can be exploited in practice. For example, an electrical utility may produce less power on a mild day based on the correlation between electricity demand and weather. In this example there is a causal relationship, because extreme weather causes people to use more electricity for heating or cooling; however, statistical dependence is not sufficient to demonstrate the presence of such a causal relationship (i.e., correlation does not imply causation).
Formally, dependence refers to any situation in which random variables do not satisfy a mathematical condition of probabilistic independence. In loose usage, correlation can refer to any departure of two or more random variables from independence, but technically it refers to any of several more specialized types of relationship between mean values." [Correlation and dependence. Wikipedia]
The chart templates example "Design elements - Scatter graphs" is included in the Scatter Diagrams solution from the Graphs and Charts area of ConceptDraw Solution Park.
Templates
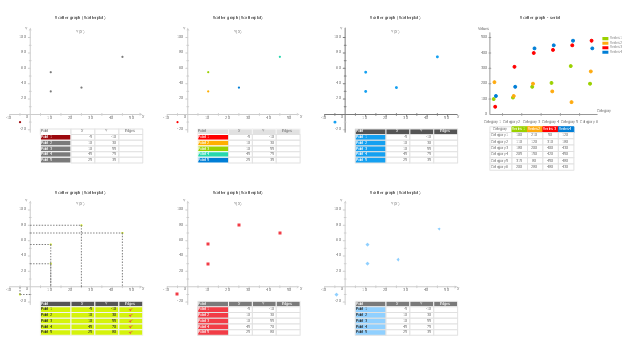
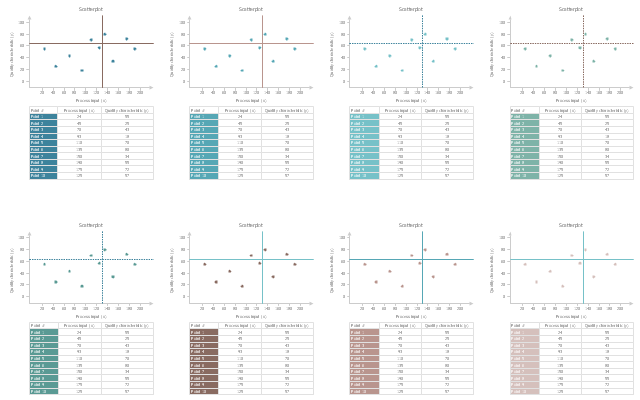
The vector stencils library "Scatter graphs" contains 7 templates of scatter diagrams (scattergraphs, scatter charts, scatter plots, scatterplots, scatter diagrams) for visual analysis of correlation between two variables.
Use these shapes to draw your scatterplots in the ConceptDraw PRO diagramming and vector drawing software.
The vector stencils library "Scatter graphs" is included in the Scatter Diagrams solution of the Graphs and Charts area in ConceptDraw Solution Park.
Use these shapes to draw your scatterplots in the ConceptDraw PRO diagramming and vector drawing software.
The vector stencils library "Scatter graphs" is included in the Scatter Diagrams solution of the Graphs and Charts area in ConceptDraw Solution Park.
Scatter graph 1
Scatter graph 2
Scatter graph 3
Scatter graph 4
Scatter graph 5
Scatter graph 6
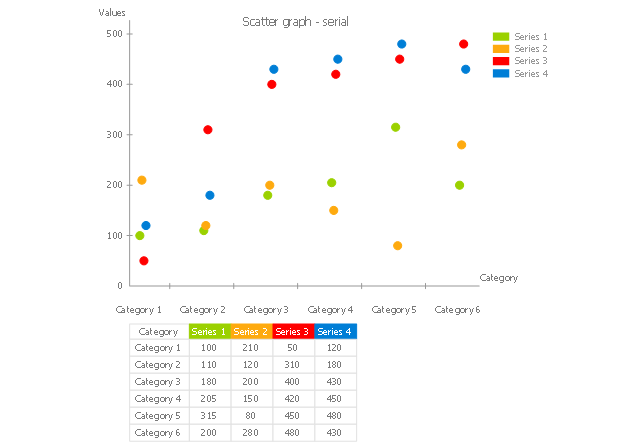
Scatter graph - serial
The vector stencils library Correlation charts from the Corellation Dashboard solution contains 4 templates of scatter plots for drawing the visual dashboards using the ConceptDraw PRO diagramming and vector drawing software.
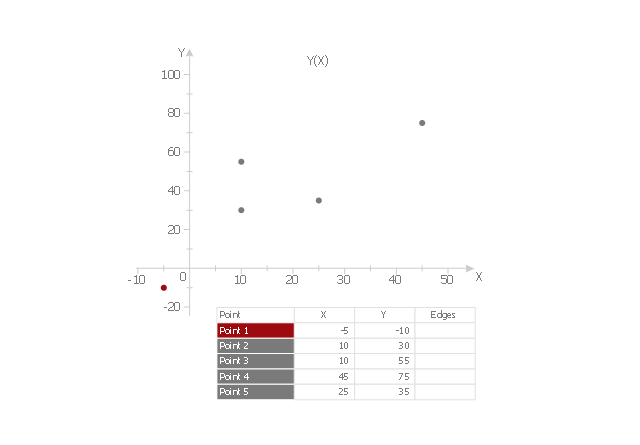
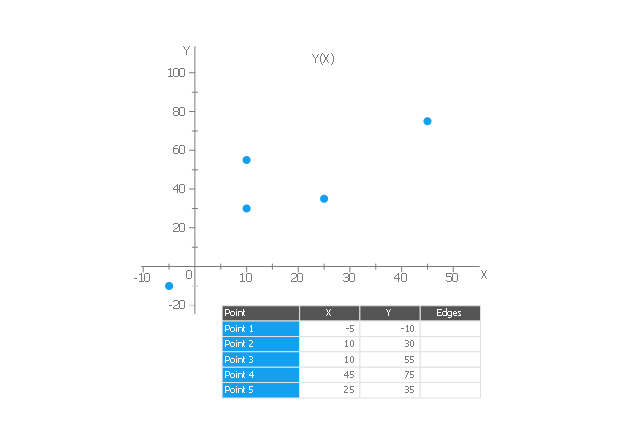
"A scatter plot, scatterplot, or scattergraph is a type of mathematical diagram using Cartesian coordinates to display values for two variables for a set of data.
The data is displayed as a collection of points, each having the value of one variable determining the position on the horizontal axis and the value of the other variable determining the position on the vertical axis. This kind of plot is also called a scatter chart, scattergram, scatter diagram, or scatter graph." [Scatter plot. Wikipedia]
The example "Design elements - Correlation charts" is included in the Corellation Dashboard solution from the area "What is a Dashboard" of ConceptDraw Solution Park.
Scatter graphs

Scatter Chart

Line Chart Templates

Line Chart Examples

The vector stencils library "Scatterplot" contains 8 scatter diagram templates.
Use to design your scatter graphs with ConceptDraw PRO diagramming and vector drawing software.
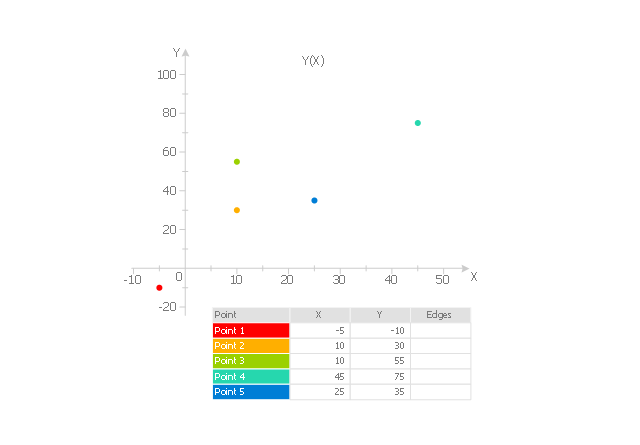
"A scatter plot, scatterplot, or scattergraph is a type of mathematical diagram using Cartesian coordinates to display values for typically two variables for a set of data. If the points are color-coded you can increase the number of displayed variables to three.
The data is displayed as a collection of points, each having the value of one variable determining the position on the horizontal axis and the value of the other variable determining the position on the vertical axis. This kind of plot is also called a scatter chart, scattergram, scatter diagram, or scatter graph. ...
The scatter diagram is one of the seven basic tools of quality control." [Scatter plot. Wikipedia]
The example of scatter chart templates "Design elements - Scatterplot" is included in the Seven Basic Tools of Quality solution from the Quality area of ConceptDraw Solution Park.
Use to design your scatter graphs with ConceptDraw PRO diagramming and vector drawing software.
"A scatter plot, scatterplot, or scattergraph is a type of mathematical diagram using Cartesian coordinates to display values for typically two variables for a set of data. If the points are color-coded you can increase the number of displayed variables to three.
The data is displayed as a collection of points, each having the value of one variable determining the position on the horizontal axis and the value of the other variable determining the position on the vertical axis. This kind of plot is also called a scatter chart, scattergram, scatter diagram, or scatter graph. ...
The scatter diagram is one of the seven basic tools of quality control." [Scatter plot. Wikipedia]
The example of scatter chart templates "Design elements - Scatterplot" is included in the Seven Basic Tools of Quality solution from the Quality area of ConceptDraw Solution Park.
Scatter graph templates
Scatter Plot

Scatter Chart Examples

Scatter Graph Charting Software

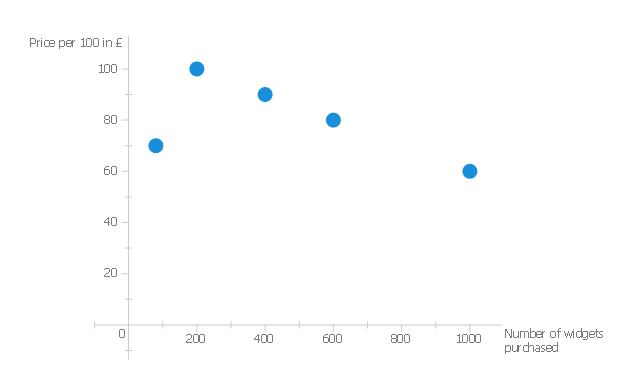
This scatter graph sample shows the correlation of widget price and number of widgets purchased.
"Correlation.
Correlation measures the strength of association between two variables. We will first consider the relationship between two scalar variables and then between ranked variables.
Pearson correlation coefficient.
Pearson's R indicates the strength and direction of association between two scalar variables, ranging from -1 which indicates a strong inverse relationship and 1 indicating a strong direct relationship. At 0 we say there is no correlation; it measures the linear dependence of one variable on another. Linear dependence means that one variable can be computed from the other by a linear equation ...
An inverse correlation.
In the following data we see that as the number of widgets rises, the price per 100 widgets falls. This is an inverse correlation and has a negative value for Pearson's R. ...
For this data the correlation coefficient has a value of -1." [en.wikibooks.org/ wiki/ Statistics_ Ground_ Zero/ Association]
The scatter chart example "Widget price correlation" was created using the ConceptDraw PRO diagramming and vector drawing software extended with the Basic Scatter Diagrams solution from the Graphs and Charts area of ConceptDraw Solution Park.
Scattergraph
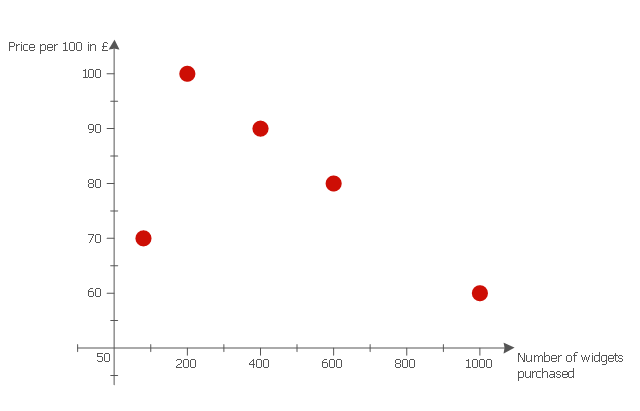
This scatter graph sample illustrates correlation between price per 100 widgets in pound sterling and number of widgets purchased.
"Correlation.
Correlation measures the strength of association between two variables. We will first consider the relationship between two scalar variables and then between ranked variables.
Pearson correlation coefficient.
Pearson's R indicates the strength and direction of association between two scalar variables, ranging from -1 which indicates a strong inverse relationship and 1 indicating a strong direct relationship. At 0 we say there is no correlation; it measures the linear dependence of one variable on another. Linear dependence means that one variable can be computed from the other by a linear equation ...
An inverse correlation.
In the following data we see that as the number of widgets rises, the price per 100 widgets falls. This is an inverse correlation and has a negative value for Pearson's R. ...
For this data the correlation coefficient has a value of -1." [en.wikibooks.org/ wiki/ Statistics_ Ground_ Zero/ Association]
The scatter chart example "Widgets price" was created using the ConceptDraw PRO diagramming and vector drawing software extended with the Scatter Diagrams solution from the Graphs and Charts area of ConceptDraw Solution Park.
Scattergraph
Scatter Graph

Line Chart Template for Word

Chart Examples

- Scatter Diagrams | Scatter graphs - Vector stencils library | Scatter ...
- Scatter Graph Charting Software | Scatter Plot | Scatter graphs ...
- Scatter graphs - Vector stencils library | Basic Diagramming | Simple ...
- Scatter Chart Examples | Scatter graph - Template | Scatter graphs ...
- Design elements - Scatterplot | Design elements - Correlation charts ...
- Easy Drawing Scatter Graphs Software Download
- Scatter Chart Examples | Design elements - Scatterplot | Design ...
- Scatter graphs - Vector stencils library
- Scatter graphs - Vector stencils library | Picture graphs - Vector ...
- Design elements - Picture graphs | Design elements - Line graphs ...
- Scattergraph
- Mind Map Scatter Graphs
- Design elements - Correlation charts
- Number of airlines departures in the given years - Line chart | Line ...
- Scatter Chart Examples | Scatter Diagrams | How to Draw a Scatter ...
- Blank Scatter Plot | Scatter Plot | Design elements - Scatterplot ...
- Line Chart Template for Word
- Scatter Graph Charting Software | Scatter Chart Examples | How to ...
- Scatter Chart Examples | Blank Scatter Plot | Scatter Graph | Scatter ...