Line Chart Templates
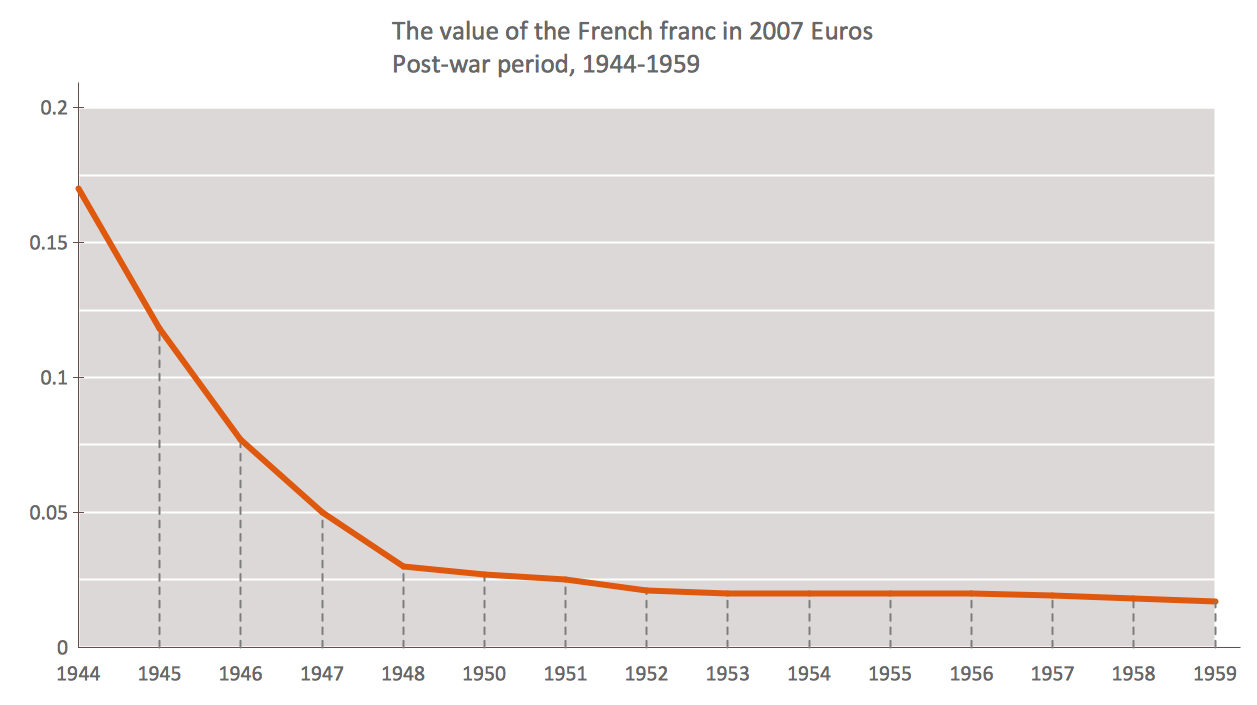
Line and scatter graphs"A line chart or line graph is a type of chart which displays information as a series of data points connected by straight line segments. It is a basic type of chart common in many fields. It is similar to a scatter plot except that the measurement points are ordered (typically by their x-axis value) and joined with straight line segments. A line chart is often used to visualize a trend in data over intervals of time – a time series – thus the line is often drawn chronologically." The Line Graphs solution from Graphs and Charts area of ConceptDraw Solution Park contains a set of examples, templates and design elements library of line and scatter charts. Use it to draw line and scatter graphs using ConceptDraw DIAGRAM diagramming and vector drawing software for illustrating your documents, presentations and websites.  Line Graph - Anual Percentage Change Line Graph - Anual Percentage Change
 Line Graph - Line Graph - Values by Categories  Line Graph - Line Graph - Time Series 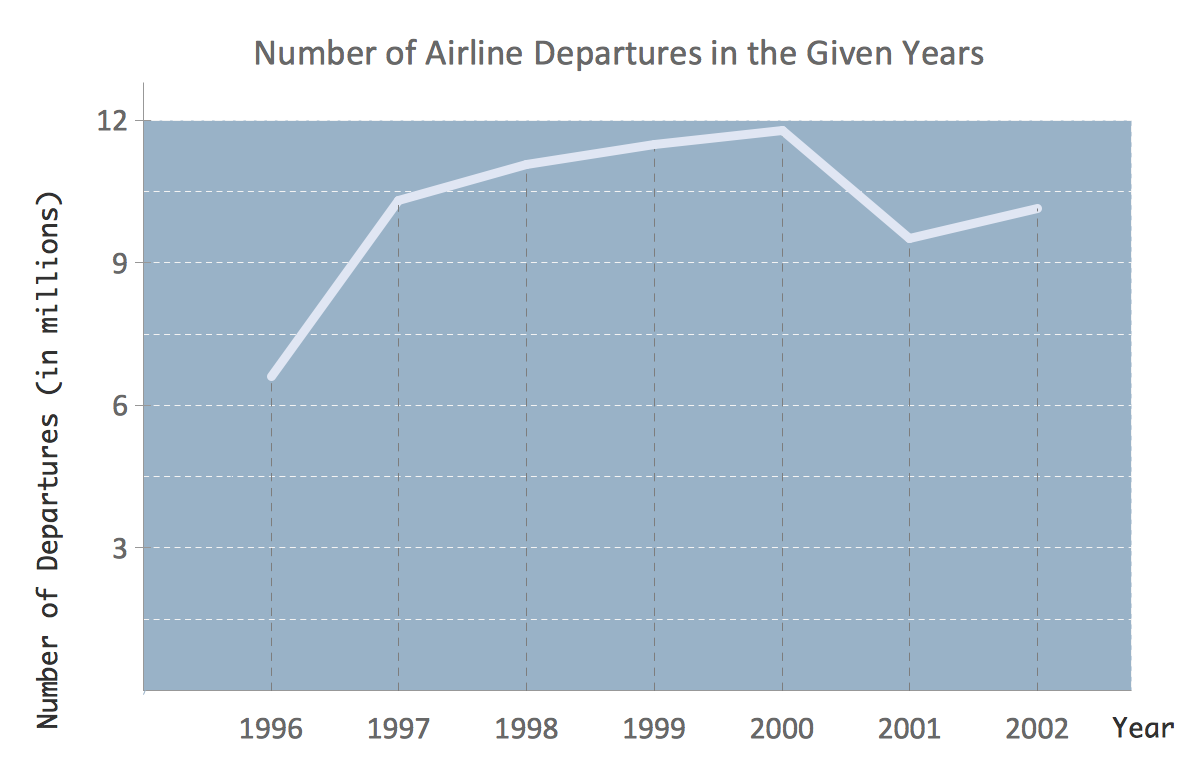 Line Graph - Line Graph - Time Series 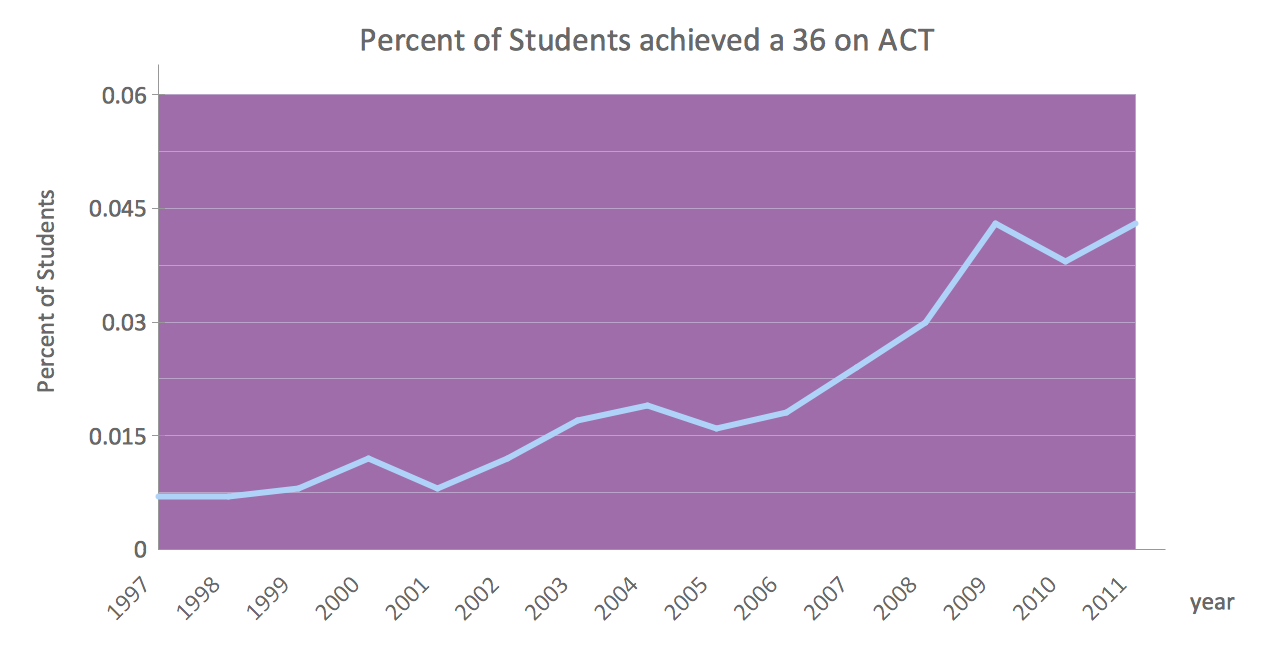 Line Graph - Anual Percentage Change Line Graph - Anual Percentage Change
 Line Graph - Line Graph - Time Series |

Pic. 1. Line Chart Templates.
See also Samples:
- Business Charts — Pie and Donut
- Business Charts — Bar and Histogram
- Business Charts — Area, Line and Scatter
- Marketing — Charts & Diagrams
- Flowcharts
- Orgcharts
- Quality and Manufacturing Charts
- Business Process Diagrams — Flow Charts
- Marketing — Flowcharts & Process Diagrams
- Business Diagrams — Concept Maps
- Business processes — Flow charts
- Marketing — Flowcharts and Process Diagrams
- Finance and Accounting
- Marketing — Social Media
- Business Diagrams
- Business Charts — Bar and Histogram