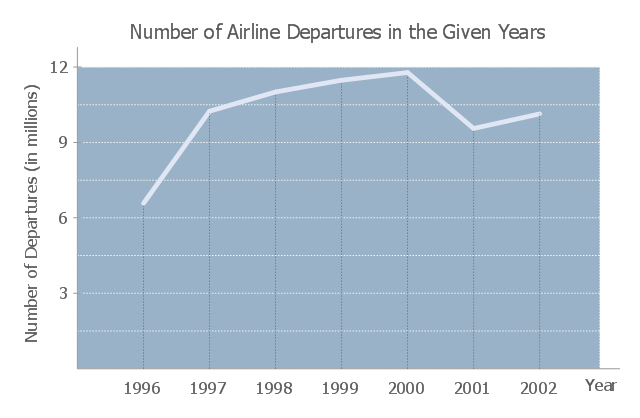
The line graph example "Number of airlines departures in the given years" was redesigned using the ConceptDraw PRO diagramming and vector drawing software from the Wikimedia Commons file: -6 time series.JPG
[commons.wikimedia.org/ wiki/ File:-6_ time_ series.JPG].
"The social science of economics makes extensive use graphs to better illustrate the economic principles and trends it is attempting to explain. Those graphs have specific qualities that are not often found (or are not often found in such combinations) in other sciences. ...
More generally, there is usually some mathematical model underlying any given economic graph. For instance, the commonly used supply-and-demand graph has its underpinnings in general price theory — a highly mathematical discipline." [Economic graph. Wikipedia]
The line graph example "Number of airlines departures in the given years" is included in the Line Graphs solution from the Graphs and Charts area of ConceptDraw Solution Park.
Line chart
Line Chart

Line Chart Examples

Line Charts

Chart Examples

Chart Templates

Line Chart Templates

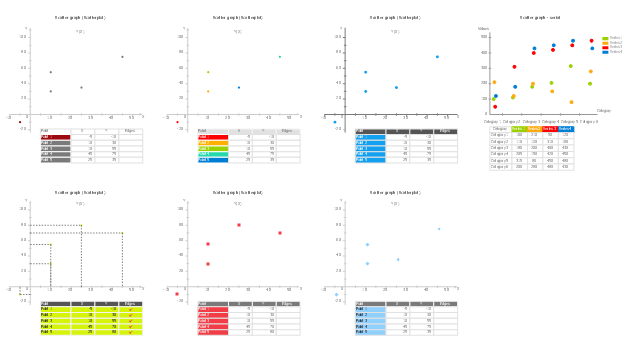
This vector stencils library contains 6 templates of scatter graphs.
The scatter graph (scattergraph. scatter chart, scatter plot, scatterplot, scatter diagram) is used for visual analysis of correlation or dependence between two variables.
"In statistics, dependence is any statistical relationship between two random variables or two sets of data. Correlation refers to any of a broad class of statistical relationships involving dependence.
Familiar examples of dependent phenomena include the correlation between the physical statures of parents and their offspring, and the correlation between the demand for a product and its price. Correlations are useful because they can indicate a predictive relationship that can be exploited in practice. For example, an electrical utility may produce less power on a mild day based on the correlation between electricity demand and weather. In this example there is a causal relationship, because extreme weather causes people to use more electricity for heating or cooling; however, statistical dependence is not sufficient to demonstrate the presence of such a causal relationship (i.e., correlation does not imply causation).
Formally, dependence refers to any situation in which random variables do not satisfy a mathematical condition of probabilistic independence. In loose usage, correlation can refer to any departure of two or more random variables from independence, but technically it refers to any of several more specialized types of relationship between mean values." [Correlation and dependence. Wikipedia]
The scatter chart templates example "Design elements - Scatter graphs" was created using the ConceptDraw PRO diagramming and vector drawing software extended with the Scatter Diagrams solution from the Graphs and Charts area of ConceptDraw Solution Park.
Scattergraph templates
 Line Graphs
How to draw a Line Graph with ease? The Line Graphs solution extends the capabilities of ConceptDraw PRO v10 with professionally designed templates, samples, and a library of vector stencils for drawing perfect Line Graphs.
Chart Maker for Presentations

- Process Flowchart | Flow chart Example . Warehouse Flowchart ...
- Line chart - Number of airlines departures in the given years | Line ...
- Chart Examples | Example Of Flowchart Symbols Departure
- Number of airlines departures in the given years - Line chart | Line ...
- France exports of goods and services - Line graph | Number of ...
- Design elements - Time series charts | Line Chart Examples | Chart ...
- How to Draw a Line Chart Quickly | How to Create a Line Chart ...
- How to Draw a Line Chart Quickly | Line Chart Template for Word ...
- Line Graph Charting Software | Line Chart Examples | Line Chart ...
- Line Chart Template for Word | Line Graph Charting Software | Line ...
- Line Chart Design
- Bar Diagrams for Problem Solving. Create economics and financial ...
- Marketing | Marketing diagrams - Vector stencils library | Marketing ...
- Chart Maker for Presentations | Line Graph | Line Chart | A Graph Or ...
- Scatter Chart Examples | Scatter graphs - Vector stencils library ...
- Aircraft examples | Aerospace and Transport | Spider Chart ...
- Process Flowchart | Line Chart Template for Word | How to Draw a ...
- Line Chart Template for Word | Chart Templates | Design elements ...
- Scatter Chart Examples
- Draw The Example Of Air Transportation