Line Chart Template for Word

This sample shows the Line Chart of annual percentage change. The Line Chart allows you to clearly see the changes of data over the time.
Line Graph Charting Software

Line Chart Examples

HelpDesk
How to Draw a Line Chart Quickly

How to Create a Line Chart

Line Chart

What Is a Line Chart

Line Charts

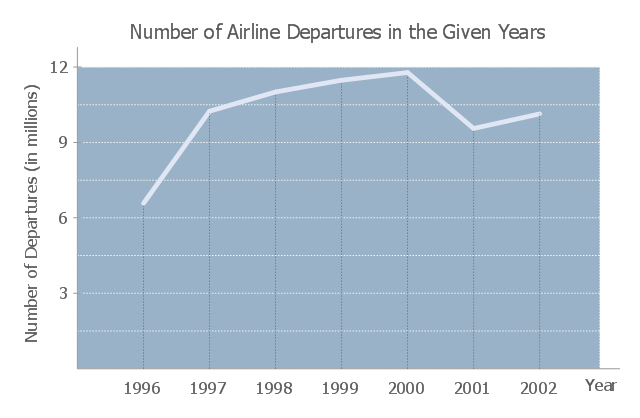
The line graph example "Number of airlines departures in the given years" was redesigned using the ConceptDraw PRO diagramming and vector drawing software from the Wikimedia Commons file: -6 time series.JPG
[commons.wikimedia.org/ wiki/ File:-6_ time_ series.JPG].
"The social science of economics makes extensive use graphs to better illustrate the economic principles and trends it is attempting to explain. Those graphs have specific qualities that are not often found (or are not often found in such combinations) in other sciences. ...
More generally, there is usually some mathematical model underlying any given economic graph. For instance, the commonly used supply-and-demand graph has its underpinnings in general price theory — a highly mathematical discipline." [Economic graph. Wikipedia]
The line graph example "Number of airlines departures in the given years" is included in the Line Graphs solution from the Graphs and Charts area of ConceptDraw Solution Park.
Line chart
Line Graph

Basic Diagramming


How to Draw a Line Graph

Create Graphs and Charts

Chart Examples

The vector stencils library "Line graphs" contains 4 templates of line graphs and scatter charts for visualizing data changes over time. Use these shapes to draw your line and scatter charts in the ConceptDraw PRO diagramming and vector drawing software extended with the Line Graphs solution from the Graphs and Charts area of ConceptDraw Solution Park.
Line graph (text -> height)
-line-graphs---vector-stencils-library.png--diagram-flowchart-example.png)
Line graph (control dots)
-line-graphs---vector-stencils-library.png--diagram-flowchart-example.png)
Scatter chart (text -> height)
-line-graphs---vector-stencils-library.png--diagram-flowchart-example.png)
Scatter chart (control dots)
-line-graphs---vector-stencils-library.png--diagram-flowchart-example.png)
- Line Chart | Basic Diagramming | Line Chart Template for Word ...
- Line Graph Charting Software | Line Chart Examples | Line Chart ...
- Chart Maker for Presentations | Sales Growth. Bar Graphs Example ...
- Bar Graphs | Line Graphs | Picture Graphs | Graphs
- Line Graph | Evolution of the population - Line chart | Line Chart ...
- Line Graph Charting Software | Line Graphs | Line Chart Template ...
- Line Graphs And Charts
- Line Chart Template for Word
- Area chart template | Line Chart Template for Word | Area Charts ...
- Line Chart Template for Word | How to Draw a Line Chart Quickly ...
- Line Chart Template for Word | Best Diagramming Software for Mac ...
- Line Chart Template for Word | Line Graph Charting Software | Line ...
- Line Graph
- Picture Graph | Pictures of Graphs | Line Chart Template for Word ...
- Line Chart Template for Word | Line graph template - The number of ...
- Pictures of Graphs | Line Chart Examples | Picture Graph | Example ...
- Line Chart Examples | Line Graph Charting Software | How to ...
- Line Chart | Line Graph | Chart Software for Better Presentations ...
- Graph Line Art Software
- Line Graph Chart Templates