Line Graph Charting Software

 Line Graphs
How to draw a Line Graph with ease? The Line Graphs solution extends the capabilities of ConceptDraw PRO v10 with professionally designed templates, samples, and a library of vector stencils for drawing perfect Line Graphs.
Line Graph

How to Draw a Line Graph

Chart Maker for Presentations

Line Chart Template for Word

Line Chart Examples

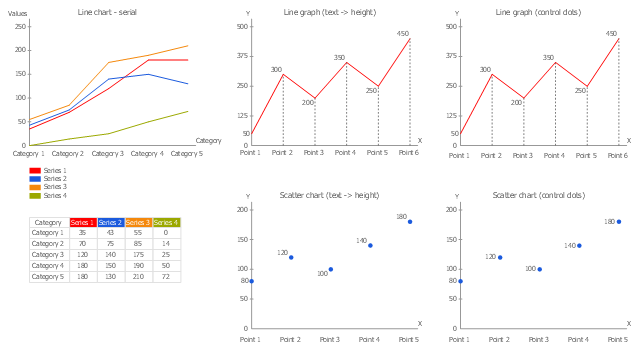
The vector stencils library "Line graphs" contains 4 templates of line graphs and scatter charts for visualizing data changes over time. Use these shapes to draw your line and scatter charts in the ConceptDraw PRO diagramming and vector drawing software extended with the Line Graphs solution from the Graphs and Charts area of ConceptDraw Solution Park.
Line graph (text -> height)
-line-graphs---vector-stencils-library.png--diagram-flowchart-example.png)
Line graph (control dots)
-line-graphs---vector-stencils-library.png--diagram-flowchart-example.png)
Scatter chart (text -> height)
-line-graphs---vector-stencils-library.png--diagram-flowchart-example.png)
Scatter chart (control dots)
-line-graphs---vector-stencils-library.png--diagram-flowchart-example.png)
What Is a Line Chart

Line Charts

"A line chart or line graph is a type of chart which displays information as a series of data points connected by straight line segments. It is a basic type of chart common in many fields. It is similar to a scatter plot except that the measurement points are ordered (typically by their x-axis value) and joined with straight line segments. A line chart is often used to visualize a trend in data over intervals of time – a time series – thus the line is often drawn chronologically." [Line chart. Wikipedia]
The templates example "Design elements - Line graphs" was drawn using the ConceptDraw PRO diagramming and vector drawing software extended with the Line Graphs solution from the Graphs and Charts area of ConceptDraw Solution Park.
The templates example "Design elements - Line graphs" was drawn using the ConceptDraw PRO diagramming and vector drawing software extended with the Line Graphs solution from the Graphs and Charts area of ConceptDraw Solution Park.
Line chart templates
The line graph example "France exports of goods and services" depicts data from the European Economic Forecast (EUROPEAN ECONOMY 1|2013, Economic and Financial Affairs Winter 2013, European Commission)
[ec.europa.eu/ economy_ finance/ publications/ european_ economy/ 2013/ pdf/ ee1_ en.pdf].
"Exports in France decreased to 36526 EUR Million in October of 2013 from 36637 EUR Million in September of 2013. Exports in France is reported by the Ministère de l'Économie et des Finances. Exports in France averaged 17102.29 EUR Million from 1970 until 2013, reaching an all time high of 37964 EUR Million in August of 2012 and a record low of 1165.60 EUR Million in May of 1970. France is one of the largest exporters of luxury goods and agricultural products in the world. France main exports are: aircrafts (10.1 percent of total exports), food (9.7 percent), chemicals (9.5 percent), industrial machinery (8.3 percent), iron and steel (7.9 percent), electronics (6.7 percent), motor vehicles (6.3 percent) and pharmaceuticals (6.1 percent). Trade outflows to Europe account for 70 percent of total exports. Main export partners are: Germany (16.6 percent of total exports), Italy (8.2 percent), Spain (7.3 percent), Belgium (7.2 percent), the United Kingdom (6.6 percent), the United States (5.6 percent), Netherlands and China. This page contains - France Exports - actual values, historical data, forecast, chart, statistics, economic calendar and news." [tradingeconomics.com/ france/ exports]
The line graph example "France exports of goods and services" was created using ConceptDraw PRO diagramming and vector drawing software extended with Line Graphs solution from Graphs and Charts area of ConceptDraw Solution Park.
Line chart
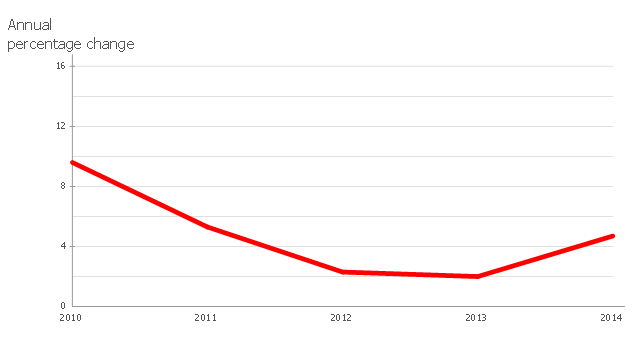
Chart Examples

HelpDesk
How to Draw a Line Chart Quickly

How to Create a Line Chart

- Bar Graphs | Line Graphs | Picture Graphs | Graphs
- Line Chart | Basic Diagramming | Line Chart Template for Word ...
- Sales Growth. Bar Graphs Example | Bar Chart Examples | Create ...
- Line Graphs | Line Graph Charting Software | How to Draw a Line ...
- Create Graphs and Charts | Line Graph Charting Software | Polar ...
- Create Graphs and Charts | How to Create a Line Chart | Line ...
- Line Chart Template for Word | Line Chart Templates | Line Graph ...
- Line Graph Charting Software | Line Chart Examples | Line graph
- Line graphs - Vector stencils library | Graphs and Charts Area ...
- Line Chart Template for Word | Line Chart Templates | Line graph ...
- Line Chart Examples | Line Graph Charting Software | Chart ...
- Line Graph Charting Software | Basic Diagramming | How to Create ...
- Create Graphs and Charts | Line Graph Charting Software ...
- Basic Diagramming | Line Graph Charting Software | Create Graphs ...
- Create Graphs and Charts | Sales Growth. Bar Graphs Example ...
- Line Graph | Line Graphs | Line Chart Examples | Line Graph Of ...
- Chart Software for Better Presentations | Line Graph | How to Create ...
- How to Create a Line Chart | Line Graph Charting Software | Line ...
- Picture Graph | Pictures of Graphs | Line Chart Template for Word ...
- Picture Graphs | Picture graph template | Line Graphs | Types Of ...