Scatter Chart
A Scatter Chart is a type of diagram which represents the data set as a collection of points in Cartesian coordinates. Each point is determined by the values of two variables.
ConceptDraw DIAGRAM offers the Scatter Diagrams solution from the Graphs and Charts Area of ConceptDraw Solution Park. It's the best choice when you need create professional looking Scatter Chart.
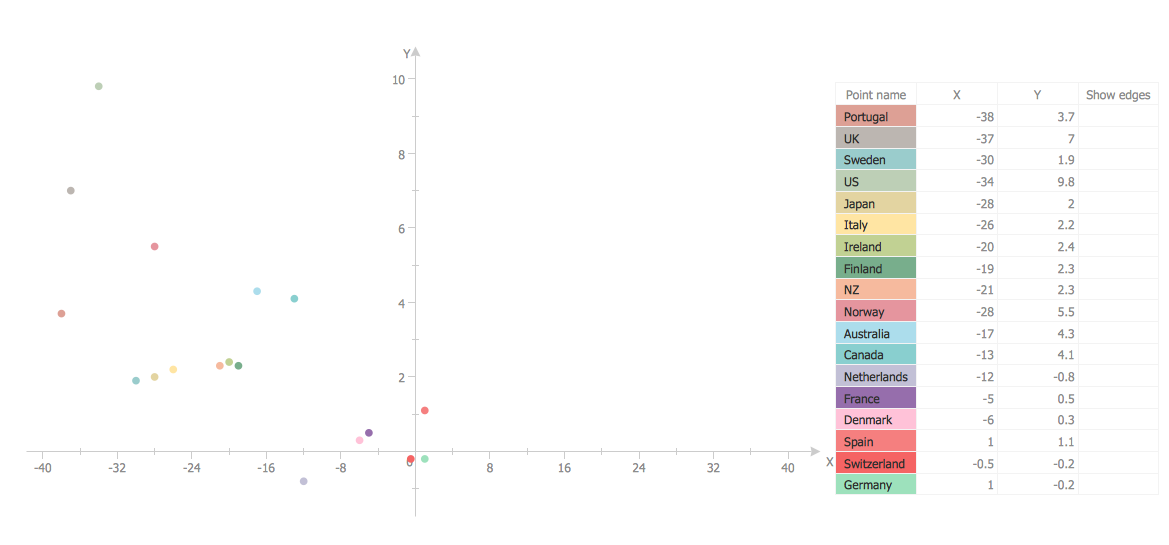
Example 1. Scatter Chart in ConceptDraw DIAGRAM /p>
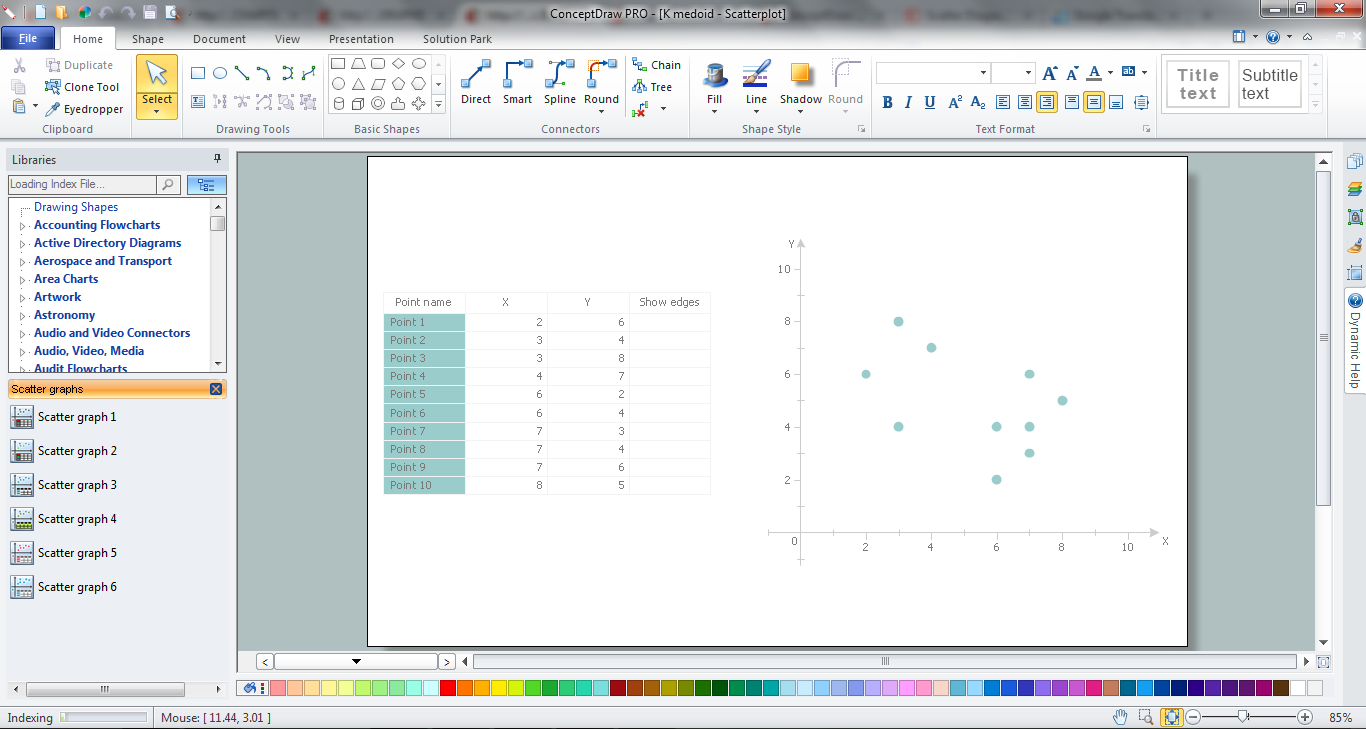
It's very useful and convenient to use the ready predesigned vector elements from the Scatter Graphs library of Scatter Diagrams solution, to design the Scatter Chart fast and simply. You can create the new ConceptDraw document and simply drag the appropriate graph object from the library.

Example 2. Scatter Graphs library - Design elements
One more easy way of Scatter Chart drawing is to use template or sample designed for Scatter Diagrams solution and available from ConceptDraw STORE.

Example 3. Scatter Chart - 2^x function
This example was created in ConceptDraw DIAGRAM using the objects from the Scatter Graphs library of Scatter Diagrams solution. It shows the graph of 2^x function. An experienced user spent 10 minutes creating this example.
Use Scatter Diagrams solution to design your own Scatter Chart of any complexity quick, easy and effective.
All source documents are vector graphic documents. They are available for reviewing, modifying, or converting to a variety of formats (PDF file, MS PowerPoint, MS Visio, and many other graphic formats) from the ConceptDraw STORE. The Scatter Diagrams Solution is available for all ConceptDraw DIAGRAM or later users.