Scatter Plot Graph
Scatter Graph Charting Software

Scatter Plot

Scatter Graph

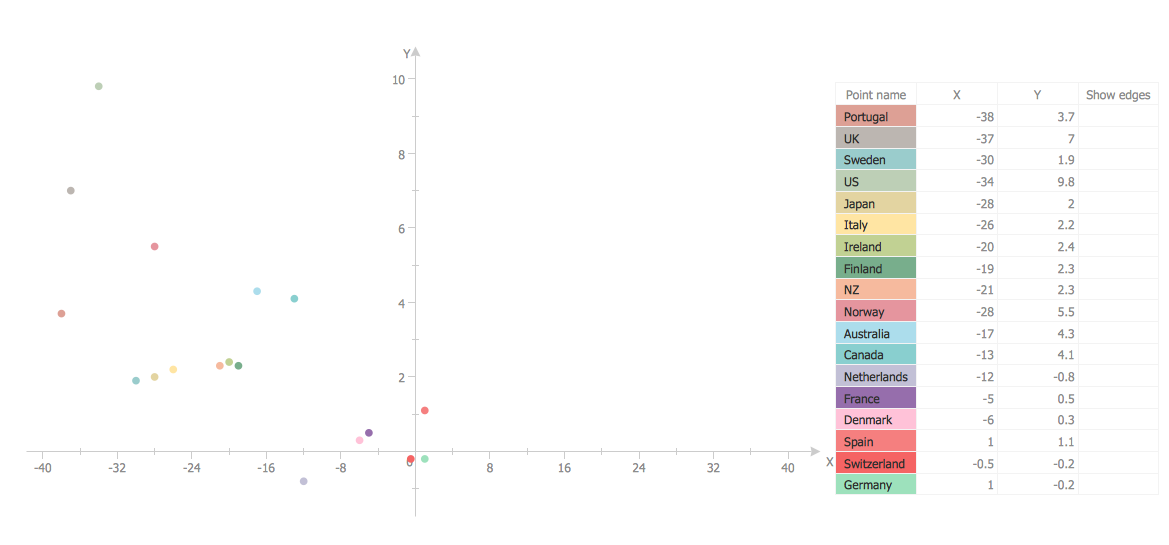
The vector stencils library "Scatterplot" contains 8 scatter diagram templates.
Use to design your scatter graphs with ConceptDraw PRO diagramming and vector drawing software.
"A scatter plot, scatterplot, or scattergraph is a type of mathematical diagram using Cartesian coordinates to display values for typically two variables for a set of data. If the points are color-coded you can increase the number of displayed variables to three.
The data is displayed as a collection of points, each having the value of one variable determining the position on the horizontal axis and the value of the other variable determining the position on the vertical axis. This kind of plot is also called a scatter chart, scattergram, scatter diagram, or scatter graph. ...
The scatter diagram is one of the seven basic tools of quality control." [Scatter plot. Wikipedia]
The example of scatter chart templates "Design elements - Scatterplot" is included in the Seven Basic Tools of Quality solution from the Quality area of ConceptDraw Solution Park.
Scatter graph templates
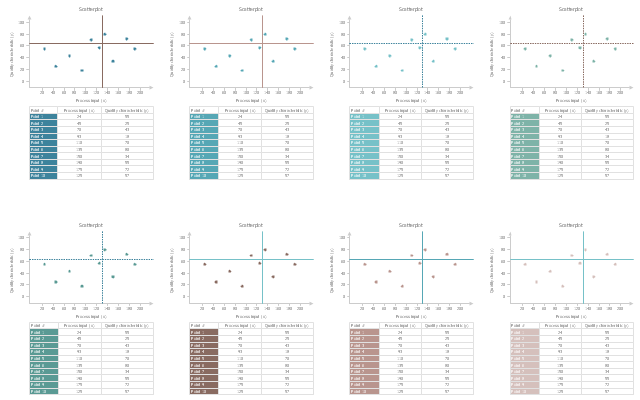
The vector stencils library Correlation charts from the Corellation Dashboard solution contains 4 templates of scatter plots for drawing the visual dashboards using the ConceptDraw PRO diagramming and vector drawing software.
"A scatter plot, scatterplot, or scattergraph is a type of mathematical diagram using Cartesian coordinates to display values for two variables for a set of data.
The data is displayed as a collection of points, each having the value of one variable determining the position on the horizontal axis and the value of the other variable determining the position on the vertical axis. This kind of plot is also called a scatter chart, scattergram, scatter diagram, or scatter graph." [Scatter plot. Wikipedia]
The example "Design elements - Correlation charts" is included in the Corellation Dashboard solution from the area "What is a Dashboard" of ConceptDraw Solution Park.
Scatter graphs

Make a Scatter Plot
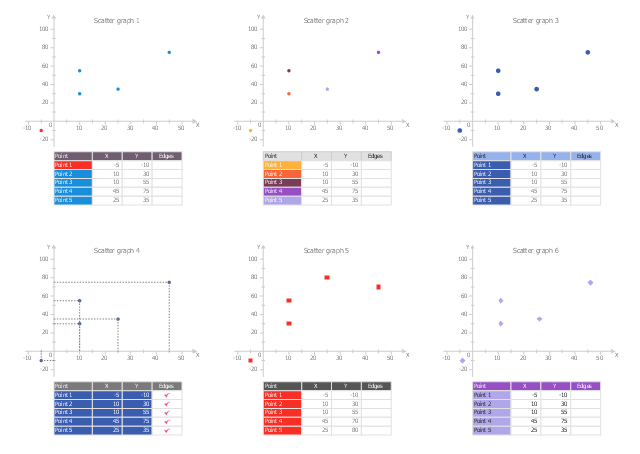
The vector stencils library "Scatter graphs" contains 6 chart templates. Use it to show the correlation or dependency between two variables in ConceptDraw PRO diagramming and vector drawing software.
The scatter graph (scattergraph. scatter chart, scatter plot, scatterplot, scatter diagram) is used for visual analysis of correlation or dependence between two variables.
"In statistics, dependence is any statistical relationship between two random variables or two sets of data. Correlation refers to any of a broad class of statistical relationships involving dependence.
Familiar examples of dependent phenomena include the correlation between the physical statures of parents and their offspring, and the correlation between the demand for a product and its price. Correlations are useful because they can indicate a predictive relationship that can be exploited in practice. For example, an electrical utility may produce less power on a mild day based on the correlation between electricity demand and weather. In this example there is a causal relationship, because extreme weather causes people to use more electricity for heating or cooling; however, statistical dependence is not sufficient to demonstrate the presence of such a causal relationship (i.e., correlation does not imply causation).
Formally, dependence refers to any situation in which random variables do not satisfy a mathematical condition of probabilistic independence. In loose usage, correlation can refer to any departure of two or more random variables from independence, but technically it refers to any of several more specialized types of relationship between mean values." [Correlation and dependence. Wikipedia]
The chart templates example "Design elements - Scatter graphs" is included in the Basic Scatter Diagrams solution from the Graphs and Charts area of ConceptDraw Solution Park.
Chart templates
HelpDesk
How to Draw a Scatter Diagram

 Scatter Diagrams
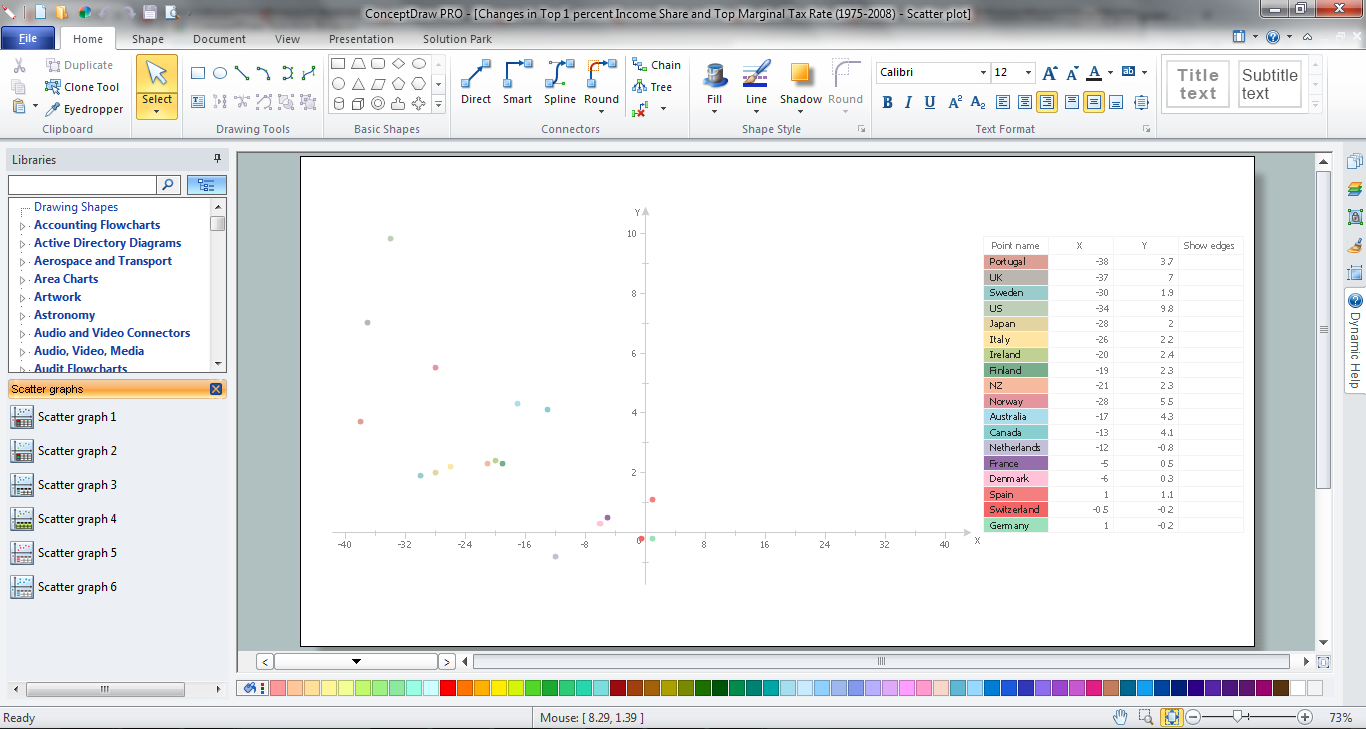
The Scatter Diagrams solution extends ConceptDraw DIAGRAM functionality with templates, samples, and a library of vector stencils that make construction of a Scatter Plot easy. The Scatter Chart Solution makes it easy to design attractive Scatter Diagrams used in various fields of science, work, and life activities. ConceptDraw DIAGRAM lets you enter the data to the table and construct the Scatter Plot Graph automatically according to these data.
- Design elements - Scatterplot | Design elements - Time series charts ...
- Scatter Plot | Design elements - Scatterplot | Blank Scatter Plot ...
- Make a Scatter Plot | Scatter Plot Graph | Scatter Chart Examples ...
- Scatter Plot | How to Draw a Scatter Diagram | Scatter Chart ...
- Design elements - Marketing charts | Scatter Chart Examples ...
- Scatter Graph Charting Software | Scatter Plot Graph | Scatter Chart ...
- Scatter Graph Charting Software | Scatter Plot | Scatter Plot Graph ...
- Plot Graphic Design
- Scatter Diagrams | Scatter Graph | Scatter Graph Charting Software ...
- Scatter Diagrams | Blank Scatter Plot | How to Draw a Scatter ...