Scatter Graph Charting Software

Scatter Plot Graph

Scatter Chart Examples

Scatter Plot

HelpDesk
How to Draw a Scatter Diagram Using ConceptDraw PRO

Make a Scatter Plot

Blank Scatter Plot

The vector stencils library Correlation charts from the Corellation Dashboard solution contains 4 templates of scatter plots for drawing the visual dashboards using the ConceptDraw PRO diagramming and vector drawing software.
"A scatter plot, scatterplot, or scattergraph is a type of mathematical diagram using Cartesian coordinates to display values for two variables for a set of data.
The data is displayed as a collection of points, each having the value of one variable determining the position on the horizontal axis and the value of the other variable determining the position on the vertical axis. This kind of plot is also called a scatter chart, scattergram, scatter diagram, or scatter graph." [Scatter plot. Wikipedia]
The example "Design elements - Correlation charts" is included in the Corellation Dashboard solution from the area "What is a Dashboard" of ConceptDraw Solution Park.
Scatter graphs

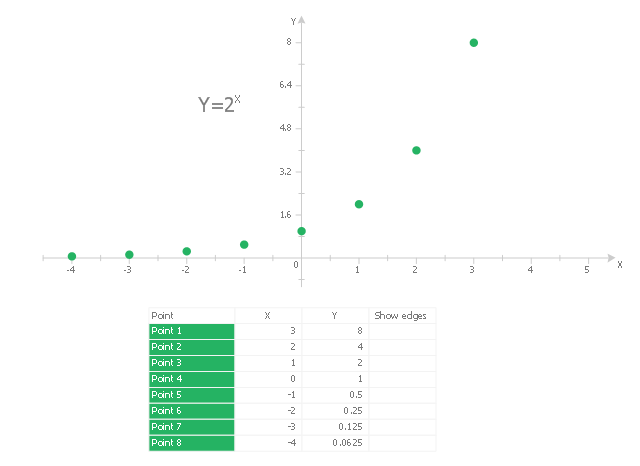
This scatter graph (scattergraph. scatter chart, scatter plot, scatterplot, scatter diagram) example visualizes exponent function.
"Exponentiation is a mathematical operation, written as bn, involving two numbers, the base b and the exponent (or power) n. When n is a positive integer, exponentiation corresponds to repeated multiplication; in other words, a product of n factors, each of which is equal to b (the product itself can also be called power)...
Exponentiation is used pervasively in many other fields, including economics, biology, chemistry, physics, as well as computer science, with applications such as compound interest, population growth, chemical reaction kinetics, wave behavior, and public-key cryptography. ...
Graphs of y = bx... Each curve passes through the point (0, 1) because any nonzero number raised to the power of 0 is 1. At x = 1, the value of y equals the base because any number raised to the power of 1 is the number itself." [Wikipedia. Exponentiation]
The scatter graph example "2^x Function" was created using the ConceptDraw PRO diagramming and vector drawing software extended with the Scatter Diagrams solution from the Graphs and Charts area of ConceptDraw Solution Park.
Scatter chart
 Scatter Diagrams
The Scatter Diagrams solution extends ConceptDraw PRO v10 functionality with templates, samples, and a library of vector stencils that make construction of a Scatter Plot easy. The Scatter Chart Solution makes it easy to design attractive Scatter Diagrams used in various fields of science, work, and life activities. ConceptDraw PRO lets you enter the data to the table and construct the Scatter Plot Graph automatically according to these data.
Basic Diagramming


Line Chart Examples

The Best Drawing Program for Mac

Best Diagramming Software for macOS


Best Program to Make Diagrams

Basic Diagramming

Basic Diagramming

Bar Chart Software

Chart Examples

- Scatter Chart Examples | Blank Scatter Plot | Line Chart Examples ...
- Scatter Chart Examples | Blank Scatter Plot | Scatter Chart Analysis ...
- Blank Scatter Plot | Scatter Chart Examples | Design elements ...
- The Best Drawing Program for Mac | Scatter Chart Examples | Line ...
- Scatter Diagram | Scatter Chart Examples | Design elements ...
- Bar Graphs | Blank Scatter Plot | Basic Diagramming | Sample Bar ...
- Design elements - Correlation charts | Blank Scatter Plot ...
- Scatter Diagrams | Scatter Diagram | Blank Scatter Plot | Scatter ...
- Scatter Chart Examples | Blank Scatter Plot | Design elements ...
- Blank Scatter Plot | Design elements - Correlation charts | Scatter ...
- Scatter Chart Examples | Scatter Diagrams | Blank Scatter Plot ...
- Correlation Dashboard | Scatter Chart Examples | The Best Choice ...
- Scatter chart - MENA's (Middle East and North Africa's) real GDP ...
- Line Graph Charting Software | Scatter Chart Examples | Visual ...
- Scatter Diagrams | Correlation Dashboard | What is a Dashboard ...
- Basic Diagramming | Line Chart Examples | Scatter Plot On Us ...
- Scatter Chart Examples | How to Create a Scatter Chart | Scatter ...
- Basic Diagramming
- Blank Scatter Plot | Donut Chart Templates | Pie Chart Examples ...
- Scatter Chart Examples