Scatter Chart Examples

 Scatter Diagrams
The Scatter Diagrams solution extends ConceptDraw DIAGRAM functionality with templates, samples, and a library of vector stencils that make construction of a Scatter Plot easy. The Scatter Chart Solution makes it easy to design attractive Scatter Diagrams used in various fields of science, work, and life activities. ConceptDraw DIAGRAM lets you enter the data to the table and construct the Scatter Plot Graph automatically according to these data.
Blank Scatter Plot
Scatter Diagram
Simple Drawing Applications for Mac

Scatter Chart Analysis. Scatter Chart Example

The Best Drawing Program for Mac

How to Create a Scatter Chart

Line Chart Examples

Basic Diagramming


Visual Presentations Made Easy with Diagramming Software


Basic Diagramming

Basic Diagramming

Basic Diagramming

Line Graph Charting Software

 Correlation Dashboard
Correlation dashboard solution extends ConceptDraw DIAGRAM software with samples, templates and vector stencils library with Scatter Plot Charts for drawing the visual dashboard visualizing data correlation.
Chart Examples

Best Vector Drawing Application for Mac OS X

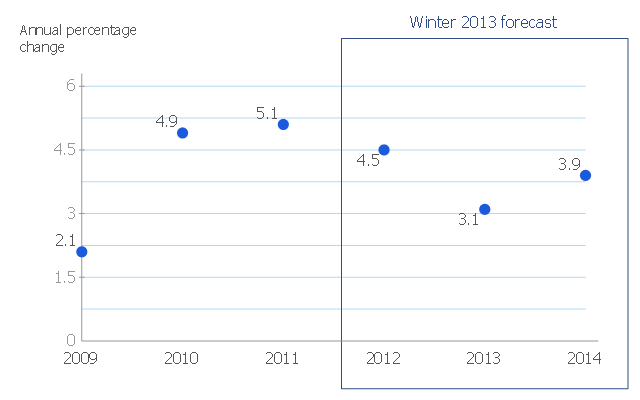
This scatter chart sample shows the MENA's (Middle East and North Africa's) real GDP growth. It was designed on the base scatter graph from the website of the European Economic Forecast (EUROPEAN ECONOMY 1|2013, Economic and Financial Affairs Winter 2013, European Commission). [ec.europa.eu/ economy_ finance/ publications/ european_ economy/ 2013/ pdf/ ee1_ en.pdf]
"The term MENA, for "Middle East and North Africa", is an acronym often used in academic, military planning, disaster relief, and business writing.
Due to the geographic ambiguity and Eurocentric nature of the term "Middle East", many people prefer use of the term WANA (West Asia and North Africa) or the less common NAWA (North Africa-West Asia).
The term covers an extensive region, extending from Morocco to Iran, including the majority of both the Middle Eastern and Maghreb countries. The term is roughly synonymous with the term the Greater Middle East. ...
MENA has no standardized definition; different organizations define the region as consisting of different territories. The following is a list of commonly included countries and territories: Bahrain, Egypt, Iran, Iraq, Israel, Jordan, Kuwait, Lebanon, Yemen, United Arab Emirates, Libya, Morocco, Oman, West Bank and Gaza, Qatar, Saudi Arabia, Syria, Tunisia, Algeria.
Sometimes also included in broader definitions: Armenia, Azerbaijan, Cyprus, Djibouti, Mauritania, Somalia, Sudan, Turkey, Western Sahara." [MENA. Wikipedia]
The scatter chart example "Middle East and North Africa's real GDP growth" was created using the ConceptDraw PRO diagramming and vector drawing software extended with the Line Graphs solution from the Graphs and Charts area of ConceptDraw Solution Park.
Scatter graph
- The Best Drawing Program for Mac | Scatter Chart Examples | Line ...
- How to Create a Scatter Chart | Scatter Chart Examples | Line Graph ...
- Scatter Chart Examples | How to Create a Scatter Chart | Scatter ...
- Blank Scatter Plot | Scatter Chart Examples | Design elements ...
- How to Create a Scatter Chart | Scatter Chart Examples | Scatter ...
- Scatter Diagram | Scatter Chart Examples | Design elements ...
- Scatter Diagrams | Scatter Diagram | Blank Scatter Plot |
- Correlation Dashboard | Scatter Chart Examples | The Best Choice ...
- Design elements - Correlation charts | Blank Scatter Plot ...
- Line Graph Charting Software | Scatter Chart Examples | Visual ...
- Scatter Chart Examples | Blank Scatter Plot | Line Chart Examples |
- Scatter Diagrams | Correlation Dashboard | What is a Dashboard ...
- Scatter Chart Examples | How to Create a ... - Conceptdraw.com
- Scatter Chart Examples
- Scatter Chart Examples | Blank Scatter Plot | Scatter Chart Analysis ...
- The Best Drawing Program for Mac | Best Diagramming Software for ...
- Pyramid Diagram and Pyramid Chart | Pyramid Chart Examples ...
- Design elements - Line graphs | Line Chart Examples | Scatter Chart ...
- Scatter Diagrams | - Conceptdraw.com
- Pyramid Chart Examples | Pyramid Diagram and Pyramid Chart ...