Make a Scatter Plot
ConceptDraw DIAGRAM diagramming and vector drawing software offers the Scatter Diagrams Solution from the Graphs and Charts Area to make a Scatter Plot creating fast and simple.
Example 1. Make a Scatter Plot in ConceptDraw
The most easier way to make a Scatter Plot is to use the predesigned templates and samples of Scatter Diagrams solution from the ConceptDraw STORE. Open the desired template or sample and change it according to your data in minutes.

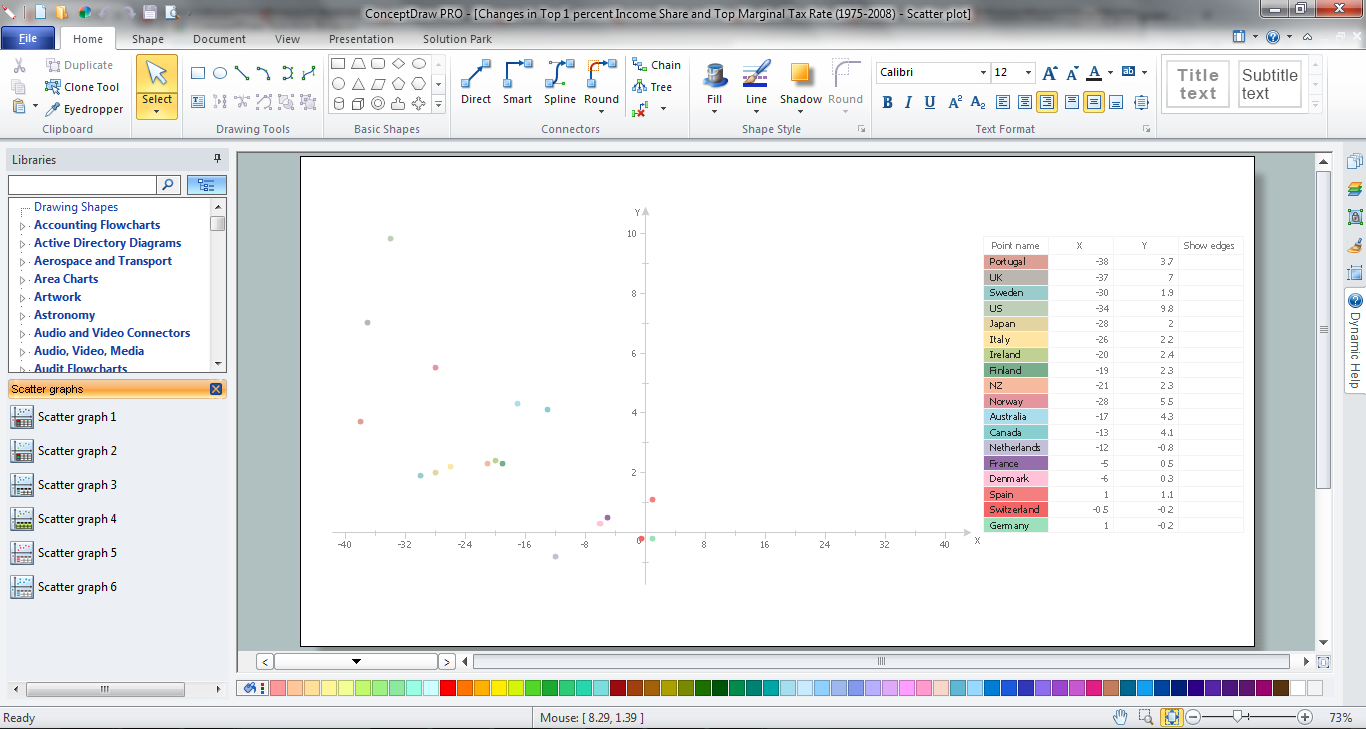
Example 2. Scatter Diagrams Solution in ConceptDraw STORE
Another way to make a Scatter Plot is create a new ConceptDraw document and use the predesigned objects offered in Scatter Graphs library of Scatter Diagrams solution.

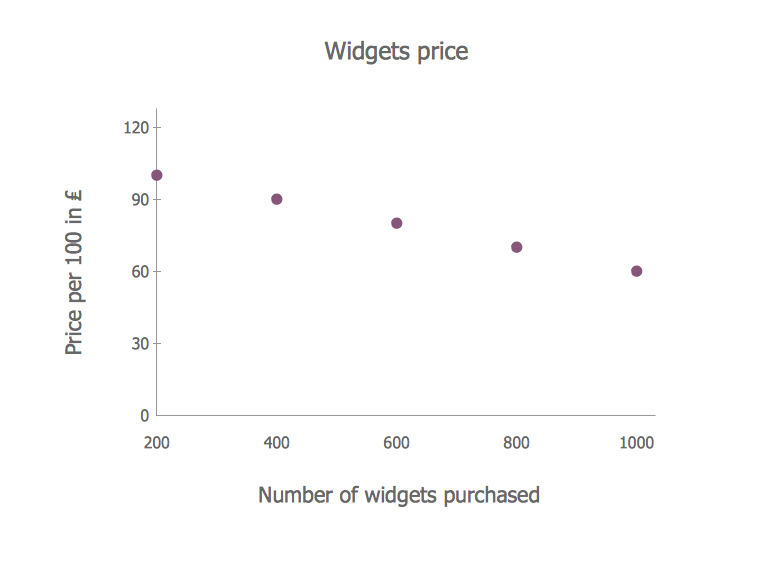
Example 3. Make a Scatter Plot - Template
This template of Scatter Plot was designed using the objects from the Scatter Graphs library of Scatter Diagrams Solution. It can be opened from ConceptDraw STORE where you can find also the set of other Scatter Plot templates and samples.
Make a Scatter Plot quick, easy, and effective using the extensive tools of Scatter Diagrams solution.
All source documents are vector graphic documents. They are available for reviewing, modifying, or converting to a variety of formats (PDF file, MS PowerPoint, MS Visio, and many other graphic formats) from the ConceptDraw STORE. The Scatter Diagrams Solution is available for all ConceptDraw DIAGRAM or later users.