Blank Scatter Plot

Scatter Chart Examples

Scatter Plot

Scatter Graph Charting Software

Make a Scatter Plot

Scatter Plot Graph

The vector stencils library Correlation charts from the Corellation Dashboard solution contains 4 templates of scatter plots for drawing the visual dashboards using the ConceptDraw PRO diagramming and vector drawing software.
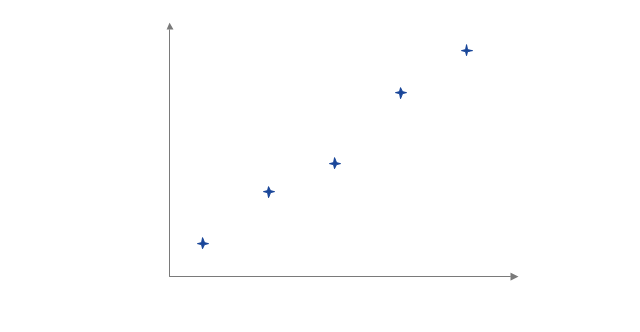
"A scatter plot, scatterplot, or scattergraph is a type of mathematical diagram using Cartesian coordinates to display values for two variables for a set of data.
The data is displayed as a collection of points, each having the value of one variable determining the position on the horizontal axis and the value of the other variable determining the position on the vertical axis. This kind of plot is also called a scatter chart, scattergram, scatter diagram, or scatter graph." [Scatter plot. Wikipedia]
The example "Design elements - Correlation charts" is included in the Corellation Dashboard solution from the area "What is a Dashboard" of ConceptDraw Solution Park.
Scatter graphs

HelpDesk
How to Draw a Scatter Diagram Using ConceptDraw PRO

 Scatter Diagrams
The Scatter Diagrams solution extends ConceptDraw PRO v10 functionality with templates, samples, and a library of vector stencils that make construction of a Scatter Plot easy. The Scatter Chart Solution makes it easy to design attractive Scatter Diagrams used in various fields of science, work, and life activities. ConceptDraw PRO lets you enter the data to the table and construct the Scatter Plot Graph automatically according to these data.
The vector stencils library "Correlation charts" contains 4 scatter plot templates.
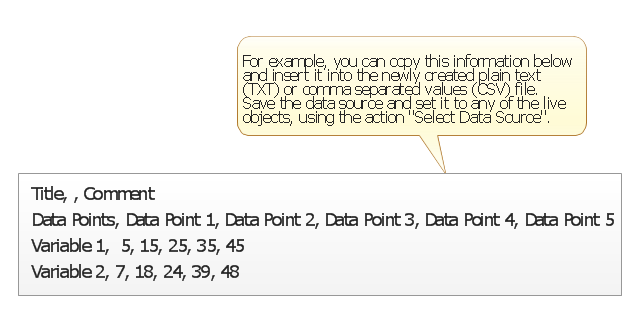
These scatterplots are Live Objects showing the relationship between two data sets from data source files.
User sets the data source file in Action menu of each scatter plot.
The scatter graphs example "Correlation charts - Vector stencils library" was created using the ConceptDraw PRO diagramming and vector drawing software extended with the Corellation Dashboard solution from the area "What is a Dashboard" of ConceptDraw Solution Park.
Scatter Plot 1
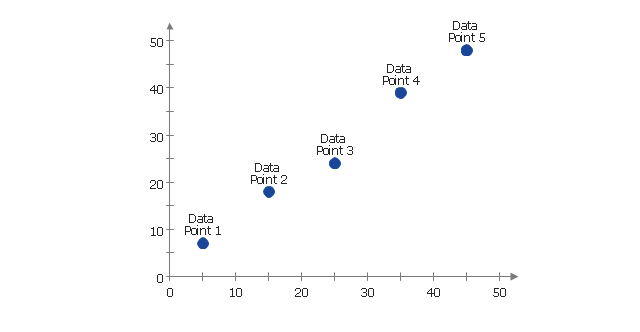
Data source file example
Scatter Plot 2
Scatter Plot 3
Scatter Plot 4
Line Chart Examples

Basic Diagramming


Basic Diagramming


Simple Drawing Applications for Mac

This example visual dashboard example shows website traffic metrics. Divided bar chart and pie chart are used to visualize compositional data. Scatter plot is used to visually analyse correlation between two data sets.
"Web traffic is the amount of data sent and received by visitors to a web site. ...
This is determined by the number of visitors and the number of pages they visit. Sites monitor the incoming and outgoing traffic to see which parts or pages of their site are popular and if there are any apparent trends, such as one specific page being viewed mostly by people in a particular country. There are many ways to monitor this traffic and the gathered data is used to help structure sites, highlight security problems or indicate a potential lack of bandwidth not all web traffic is welcome. Some companies offer advertising schemes that, in return for increased web traffic (visitors), pay for screen space on the site. Sites also often aim to increase their web traffic through inclusion on search engines and through search engine optimization." [Web traffic. Wikipedia]
The example "Website traffic dashboard" was created using the ConceptDraw PRO diagramming and vector drawing software extended with the Corellation Dashboard solution from the area "What is a Dashboard" of ConceptDraw Solution Park.
Visual dashboard


The Best Drawing Program for Mac

Best Program to Make Diagrams

Basic Diagramming

The Best Flowchart Software Available

- Scatter Chart Examples | Blank Scatter Plot | Scatter Chart Analysis ...
- Scatter Chart Examples | Blank Scatter Plot | Line Chart Examples ...
- Scatter Diagrams | Scatter Diagram | Blank Scatter Plot | Scatter ...
- Blank Scatter Plot | Scatter Chart Examples | Design elements ...
- Scatter Chart Examples | Scatter Diagrams | Blank Scatter Plot ...
- Scatter Chart Examples | Blank Scatter Plot | Design elements ...
- Blank Scatter Plot | Design elements - Correlation charts | Scatter ...
- Design elements - Correlation charts | Blank Scatter Plot ...
- The Best Drawing Program for Mac | Scatter Chart Examples | Line ...
- Basic Diagramming
- Scatter Diagram | Scatter Chart Examples | Design elements ...
- Bar Graphs | Blank Scatter Plot | Basic Diagramming | Sample Bar ...
- Correlation Dashboard | Scatter Chart Examples | The Best Choice ...
- Line Graph Charting Software | Scatter Chart Examples | Visual ...
- Scatter Diagrams | Correlation Dashboard | What is a Dashboard ...
- Scatter Chart Examples | How to Create a Scatter Chart | Scatter ...
- Scatter chart - MENA's (Middle East and North Africa's) real GDP ...
- Basic Diagramming | Line Chart Examples | Scatter Plot On Us ...
- Scatter Chart Examples
- Blank Scatter Plot | Donut Chart Templates | Pie Chart Examples ...