Project — Working With Tasks
A full-featured project management solution with all the necessary functions right at your fingertips. Generates an extensive variety of reports on project and task statuses.These videos provide a series of lessons that will enhance the understanding of all our users, from people just starting out with the software, through to expert users.
How to Report Task's Execution with Gantt Chart
ConceptDraw PROJECT’s powerful reporting engine lets you generate a set of tabular reports with just one click, or visualize your project as Radial Tasks Structures, Work Breakdown Structures and Resource Calendars. It also provides you with dynamic Project Dashboards.
 PM Response
This solution extends all ConceptDraw Office 2.0 products by helping to improve the response time to project changes. PM Response also helps with iteration planning, discussing project layout approaches, and solving project challenges.
 PM Easy
This solution extends ConceptDraw PROJECT software with the ability to quickly start a project; it lists task relationships and dependencies to make iterative planning easy.
Gantt Chart Diagram
PM Made Easy allows you to plan and execute projects using mind mapping techniques, implement planning using mind mapping, and track tasks using CD Project.HelpDesk
How to Create Project Diagrams on PC
Project diagrams gives the ability to view at a detailed level project attributes such as project scope, logical connections in the project, critical paths, key events on the timeline, milestones, tasks, calendars for work, and resource utilization. Representing various project data in a visual form is a way to overview and represent project information to stakeholders. ConceptDraw PROJECT Reports allows creating 9 types of project diagrams that are generated in ConceptDraw PRO.WBS Diagram
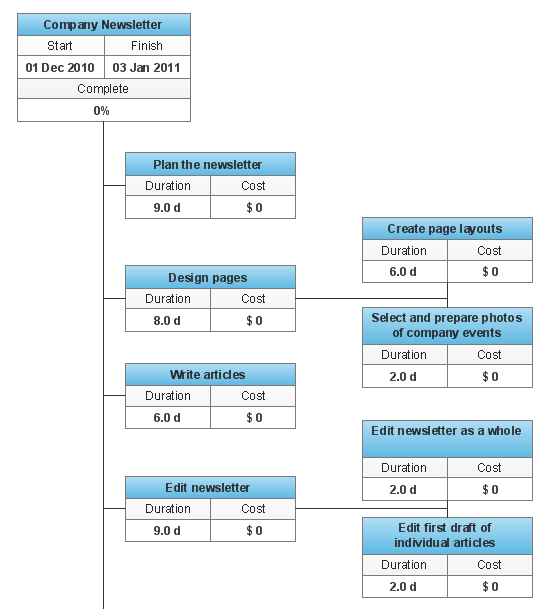
Represent a set of planned outcomes that define 100% of the project scope. Create Work Breakdown Structure (WBS) diagram.Gant Chart in Project Management
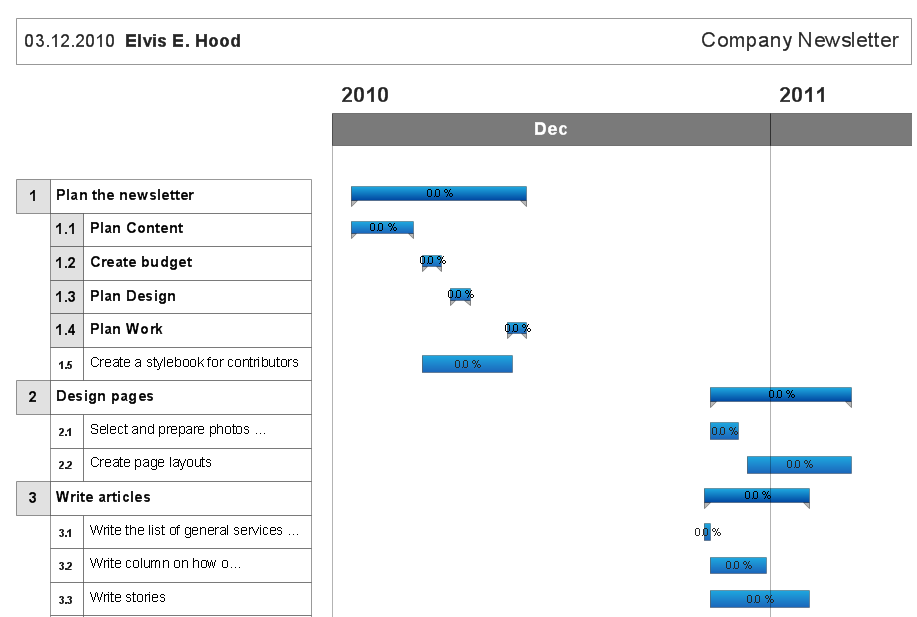
Gant Chart is a graphical representation of tasks as segments on a time scale. It helps plan and monitor project development or resource allocation. The horizontal axis is a time scale, expressed either in absolute or relative time.
PERT Chart Software
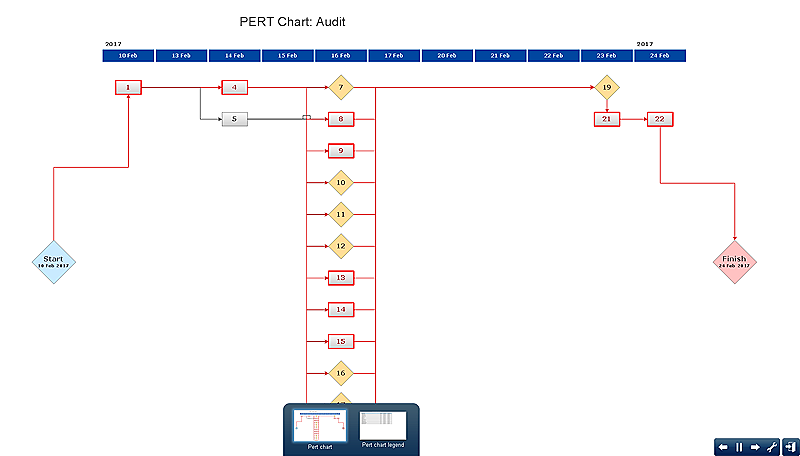
PERT Chart Software - Activity Network and Project Evaluation and Review Technique, or PERT, charts are a way of documenting and analyzing the tasks in a project.ConceptDraw PRO is a powerful diagramming and vector drawing software for designing professional looking PERT Charts quick and easy.
Advanced printing in ConceptDraw Project
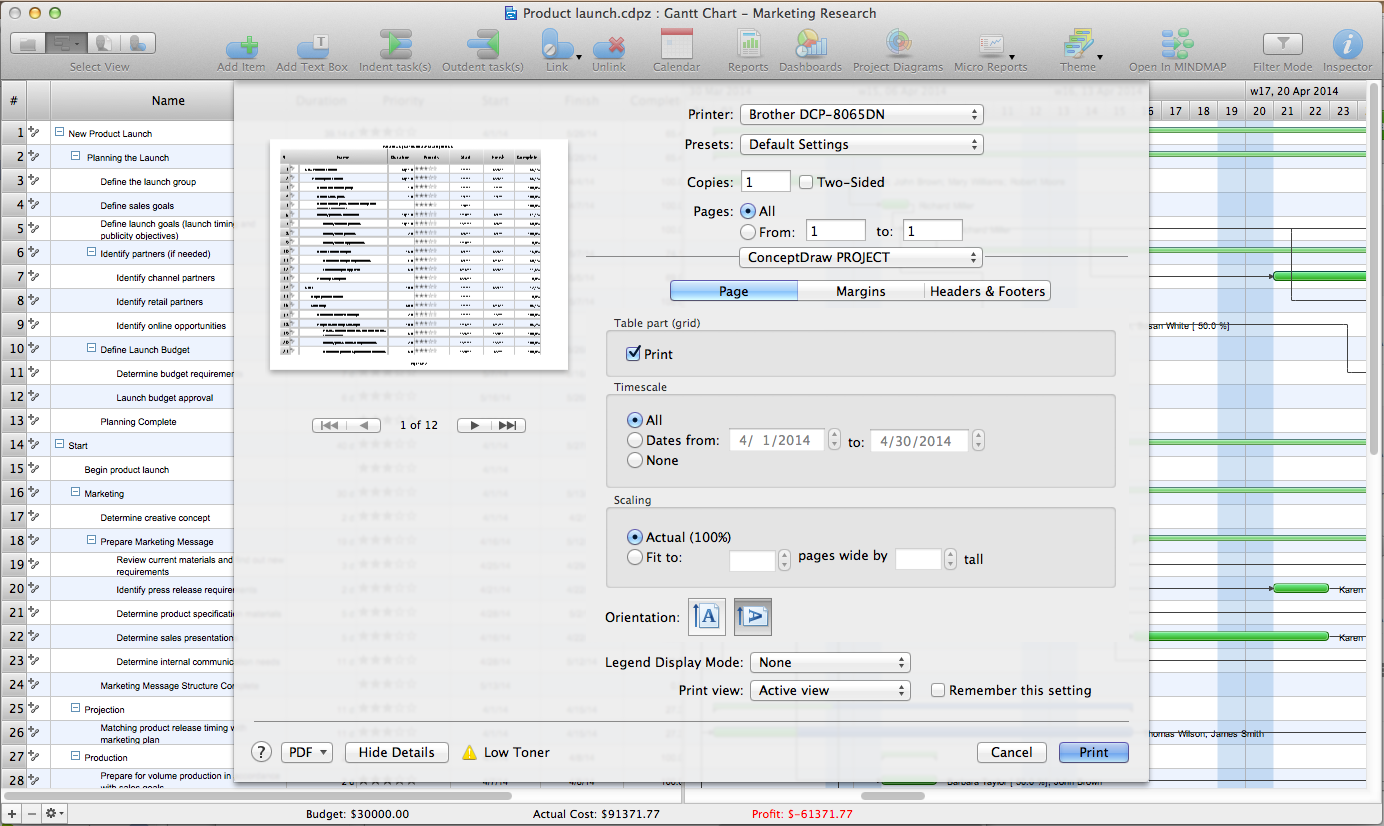
ConceptDraw PROJECT has flexible print settings that allowing you to easily print your project data to suite any need.Gantt chart examples
All Gantt charts were made using ConceptDraw PROJECT. ConceptDraw PROJECT works both on Windows and Mac OS X. It allows to schedule a voluntary number of projects in a single Workspace document and lets easily share tasks and resources among them. ConceptDraw PROJECT shares files among Windows and Mac OS X.Gantt Chart Software
The Gantt Chart is the main interface in ConceptDraw PROJECT. It summarizes the tasks in your project and presents them graphically so you can easily view your progress.Horizontal Org Flow Chart
This sample was created in ConceptDraw PRO diagramming and vector drawing software using the Organizational Charts Solution from the Management area of ConceptDraw Solution Park.The Organizational Chart is a diagram that shows the structure of the organization, different levels of management, hierarchy and the relationships of the organization parts.
Process Flow Chart
A Process Flow Chart is a type of flowchart which is mostly used in industrial, chemical and process engineering for illustrating high-level processes, major plant processes and not shows minor details.ConceptDraw PRO diagramming and vector drawing software extended with Flowcharts Solution from the "What is a Diagram" Area of ConceptDraw Solution Park is the best way to create Process Flow Chart and other types of flowcharts.
How to Create Gantt Chart
To begin managing a new project, you will need to define the individual Tasks that must be completed to deliver it. The default view for a new project in ConceptDraw PROJECT is the Gantt Chart.- Radial Tasks Diagram
- How to Report Task's Execution with Gantt Chart
- Project — Working With Tasks | PM Response | Gantt Chart Software ...
- Organizational Structure | Project — Working With Tasks | Structured ...
- Project — Working With Tasks | How to Report Task's Execution with ...
- WBS Diagram | ConceptDraw Arrows10 Technology | How to Report ...
- How to Report Task's Execution with Gantt Chart
- Project — Task Trees and Dependencies | Project management task ...
- Architectural Radial Parking Layout
- Activity Network Diagram Method | Program Evaluation and Review ...
- Wbs Diagram Park
- PM Easy | How to Report Task's Execution with Gantt Chart | Product ...
- How to Report Task's Execution with Gantt Chart | Activity Network ...
- WBS Diagram | How to Report Task's Execution with Gantt Chart ...
- How to Report Task's Execution with Gantt Chart | | Org Chart ...
- Product Overview | WBS Diagram | How to Report Task's Execution ...
- Radial Progress Chart
- PM Easy | How to Report Task's Execution with Gantt Chart ...
- WBS Diagram | PM Easy | How to Report Task's Execution with ...
- Gant Chart in Project Management | How to Report Task's Execution ...
- ERD | Entity Relationship Diagrams, ERD Software for Mac and Win
- Flowchart | Basic Flowchart Symbols and Meaning
- Flowchart | Flowchart Design - Symbols, Shapes, Stencils and Icons
- Flowchart | Flow Chart Symbols
- Electrical | Electrical Drawing - Wiring and Circuits Schematics
- Flowchart | Common Flowchart Symbols
- Flowchart | Common Flowchart Symbols


