Gantt Chart Diagram
Project Management
In PM solutions we support many project methodologies such as Agile and Simple Projects. Methodology solutions help in implementing best practices in project management. CS Odessa provides Toolbox solutions to support solving issues related to planning, tracking, milestones, events, resource usage, and other typical project management functions. Toolbox Solutions help you deal with common project situations in an extraordinary way.
PM Easy
ObjectiveSupports methodology neutral project management.
Solution PurposeRapid project startup is possible using mind mapping to gather requirements from your team and then plan activities in visual mind mapping format. Using mind mapping one can establish time lines, delineate tasks, assign resources, and organize overall project structure. The flexibility of using mind mapping to start a project is the most efficient manner to build the initial project plan.
Intended ForProject managers of small projects that work in a small or medium size organization, and are starting to use a project methodology. This solution is targeted for project managers who are looking for easy ways to get their projects successfully started.
BenefitsThis solution helps you quickly start a project efficiently by listing tasks relations and dependencies. It makes iterative planning really easy because of the flexible and visual nature of mind mapping. Visual tools such as mind mapping, increases the effectiveness of task tracking and analyses.
Products and MethodsPM Made Easy allows you to plan and execute projects using mind mapping techniques, implement planning using mind mapping, and track tasks using ConceptDraw Project.
Gantt Chart Diagram
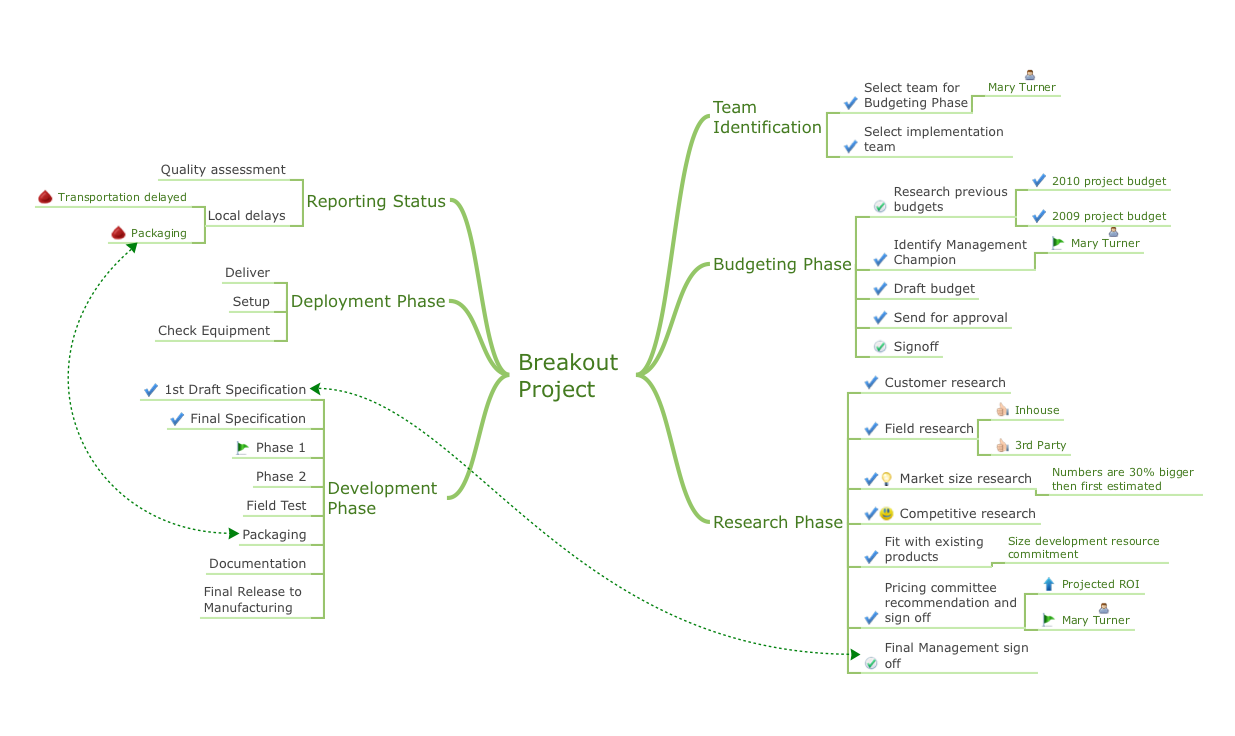
- Represent the scope and the basic structure of your project. Create Gantt chart from your project mind map. Double click the icon to create a Gantt chart.
- The diagram is created automatically from the active page of your map by ConceptDraw DIAGRAM and will be opened in Slideshow mode.
- The Main Idea creates Project name. Main Topics and next level Subtopics create Tasks and Subtasks.
- Task information that was assigned to topics by Project Topic Type will be also displayed at the diagram.
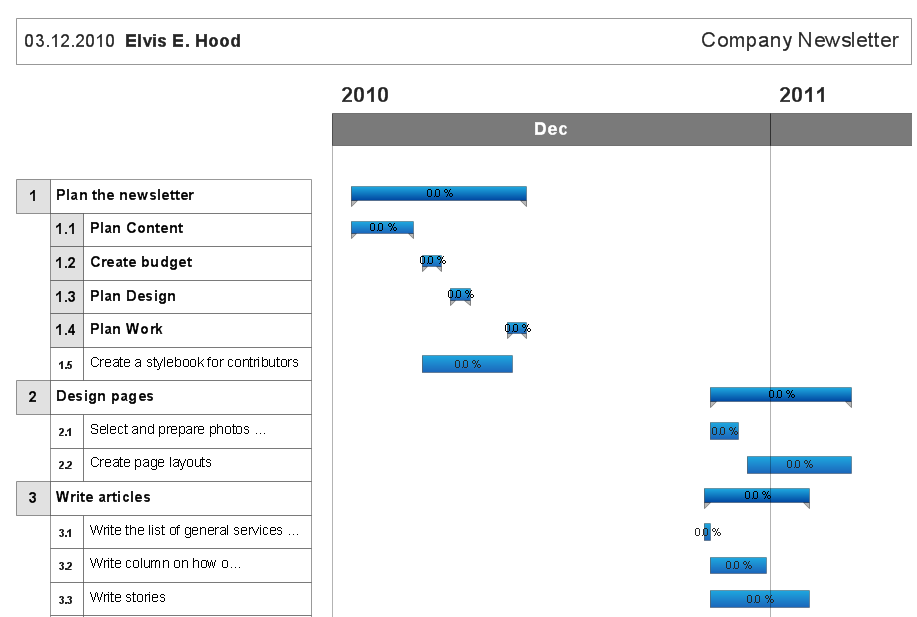
Example 1. Gantt Chart Diagram
The Benefits for ConceptDraw MINDMAP Brainstorming Software
- ConceptDraw MINDMAP is effective for brainstorming, designing mind maps, idea generating, creative and lateral thinking, creativity and problem solving.
- ConceptDraw MINDMAP is ideal for team and personal work in Business, Marketing and Project Management.
- The libraries with large quantity of vector objects help to illustrate your mind maps and to make them bright, visual and comprehensible.
- Use of View Navigator tool lets create presentations from a mind map: you can simply select the map parts you want to present, sequence your slides, and preview the presentation.
- ConceptDraw MINDMAP provides wide capabilities of importing and exporting in various formats: Microsoft PowerPoint, Microsoft Word, MS Excel, Mindjet MindManager, image, HTML, PDF file.