HelpDesk
How To Create a PERT Chart Using PM Easy Solution

Program Evaluation and Review Technique (PERT) with ConceptDraw DIAGRAM
 with ConceptDraw DIAGRAM *")
PERT Chart Software

ConceptDraw DIAGRAM is a powerful diagramming and vector drawing software for designing professional looking PERT Charts quick and easy.
Activity Network (PERT) Chart
 Chart *")
This diagram is constructed as part of the process in creating a schedule of corrective actions. The Activity Network Chart (PERT) shows the logical connections and consequence of tasks to be performed. It displays the time period for problem solving and the implementation of all activities through the critical path.
PERT Chart

CORRECTIVE ACTIONS PLANNING. PERT Chart

ConceptDraw Office suite is a software for corrective actions planning.

The PERT chart shows the logical connections and consequence of a set of tasks. PERT charts the time period for problem solving and the implementation plan for all activities along the critical path. The PERT chart is also known as a precedence diagram or project network diagram.
"The Program (or Project) Evaluation and Review Technique, commonly abbreviated PERT, is a statistical tool, used in project management, that is designed to analyze and represent the tasks involved in completing a given project. ...
PERT is a method to analyze the involved tasks in completing a given project, especially the time needed to complete each task, and to identify the minimum time needed to complete the total project.
PERT was developed primarily to simplify the planning and scheduling of large and complex projects. ...
A network diagram can be created by hand or by using diagram software. There are two types of network diagrams, activity on arrow (AOA) and activity on node (AON). Activity on node diagrams are generally easier to create and interpret." [Program Evaluation and Review Technique. Wikipedia]
The PERT chart is one of the Seven Management and Planning Tools (7 MP tools, Seven New Quality Tools).
The PERT chart template for the ConceptDraw PRO diagramming and vector drawing software is included in the solution "Seven Management and Planning Tools" from the Management area of ConceptDraw Solution Park.
PERT chart template

Legend

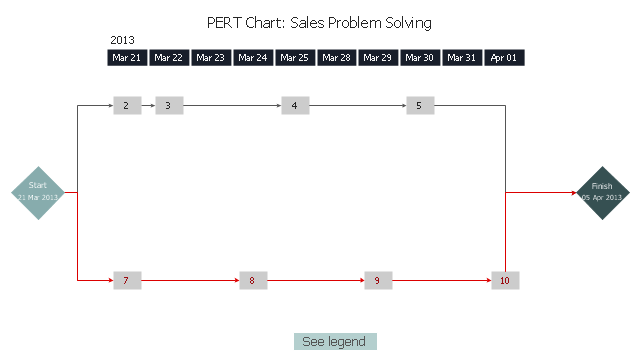
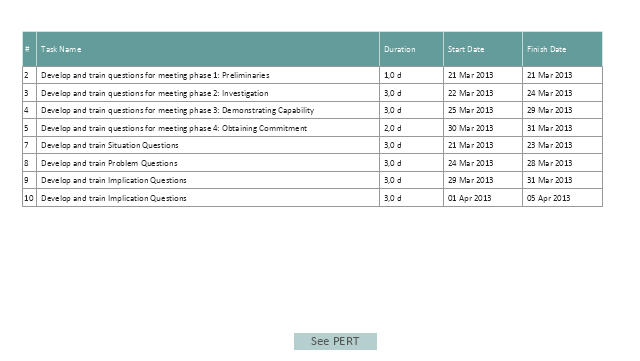
"Solution selling is a sales methodology. Rather than just promoting an existing product, the salesperson focuses on the customer's pain(s) and addresses the issue with his or her offerings (product and services). The resolution of the pain is what constitutes a "solution". ...
Followers of "solution-selling" generally apply a consultative sales approach to all aspects of their sales process (or during a sales cycle) including:
Prospecting;
Diagnosing customer needs;
Crafting a potential solution;
Establishing value;
Bargaining for access to decision-makers;
Positioning proof, ROI and the total solution;
Negotiating a win-win solution;
Following up to ensure customer success.
The solution selling methodology has evolved as key components of professional selling evolve. As a result, solution selling has become more broadly defined - to include dimensions of "sales process", "competitive selling", "value selling" as well as "consultative selling" or "complex selling" which set the focus on the team's aspects of the sales." [Solution selling.Wikipedia]
The PERT chart example "Sale problem solution" was created using the ConceptDraw PRO diagramming and vector drawing software extended with the solution Seven Management and Planning Tools from the Management area of ConceptDraw Solution Park.
PERT
Legend
PERT Chart

"A project network is a graph (flow chart) depicting the sequence in which a project's terminal elements are to be completed by showing terminal elements and their dependencies.
... the project network shows the "before-after" relations.
The most popular form of project network is activity on node, the other one is activity on arrow.
The condition for a valid project network is that it doesn't contain any circular references." [Project network. Wikipedia]
The PERT chart example "Project management plan" was created using the ConceptDraw PRO diagramming and vector drawing software extended with the solution "Seven Management and Planning Tools" from the Management area of ConceptDraw Solution Park.
PERT

Legend

Activity Network Diagram Method

This sample shows the PERT (Program Evaluation Review Technique) chart of the request on proposal. A request for proposal (RFP) is a request of the company or the organization to potential suppliers to submit the business proposals for service or goods that it is interested to purchase. The RFP is represented on the initial procurement stage and allows to define the risks and benefits.
"A request for proposal (RFP) is a solicitation made, often through a bidding process, by an agency or company interested in procurement of a commodity, service or valuable asset, to potential suppliers to submit business proposals. It is submitted early in the procurement cycle, either at the preliminary study, or procurement stage. The RFP process brings structure to the procurement decision and is meant to allow the risks and benefits to be identified clearly up front.
The RFP presents preliminary requirements for the commodity or service, and may dictate to varying degrees the exact structure and format of the supplier's response. Effective RFPs typically reflect the strategy and short/ long-term business objectives, providing detailed insight upon which suppliers will be able to offer a matching perspective.
Similar requests include a request for quotation and a request for information.
In principle, an RFP:
(1) informs suppliers that an organization is looking to procure and encourages them to make their best effort.
(2) requires the company to specify what it proposes to purchase. If the requirements analysis has been prepared properly, it can be incorporated quite easily into the Request document.
(3) alerts suppliers that the selection process is competitive.
(4) allows for wide distribution and response.
(5) ensures that suppliers respond factually to the identified requirements.
(6) is generally expected to follow a structured evaluation and selection procedure, so that an organization can demonstrate impartiality - a crucial factor in public sector procurements." [Request for proposal. Wikipedia]
The PERT chart example "Request for proposal (RFP)" was created using the ConceptDraw PRO diagramming and vector drawing software extended with the solution Seven Management and Planning Tools from the Management area of ConceptDraw Solution Park.
PERT
.png--diagram-flowchart-example.png)
Legend
.png--diagram-flowchart-example.png)
How to Discover Critical Path on a Gantt Chart

How To create Value Stream Map (VSM)
 *")
HelpDesk
How to Create Project Diagrams on PC

The Action Plan

ConceptDraw Office suite is a software for decision making and action plan.
How To Create a Flow Chart in ConceptDraw

Put an initial object from library to a page and use RapidDraw technology clicking on direction arrows to add new objects to the flowchart. This way you can make flowchart quickly.
How to Create Presentation of Your Project Gantt Chart

Root Cause Analysis

Analyze the root causes for factors that influenced the problem. This diagram is constructed separately for each highly prioritized factor. The goal of this is to find the root causes for the factor and list possible corrective action.
Network Analysis Activity on Node

- How To Create a PERT Chart | How to Create Project Diagrams on ...
- How To Create a PERT Chart Using PM Easy Solution | Business ...
- How to Discover Critical Path on a Gantt Chart | PERT Chart ...
- PERT chart - Sale problem solution | How To Create a PERT Chart ...
- How To Create a PERT Chart | Pert Chart For Restaurant Order
- Pert Chart Project Examples
- PERT chart - Template | Pert Chart Xls
- Pert Chart For Library Management System
- Process Flowchart | Interior Design | Activity Network ( PERT ) Chart ...
- Activity Network ( PERT ) Chart | Structured Systems Analysis and ...
- Pert Chart Calculator Online
- How To Create a PERT Chart Using PM Easy Solution | Program ...
- Pert Chart
- PERT chart - Project management plan | PERT chart - Template ...
- How To Create a PERT Chart | Pert Diagram Visio
- Program Evaluation and Review Technique ( PERT ) with ...
- How To Create a PERT Chart | Gantt charts for planning and ...
- Activity Network ( PERT ) Chart | Pert Chart For Railway Reservation ...
- PERT chart - Template | PROBLEM ANALYSIS. Prioritization Matrix ...
- CORRECTIVE ACTIONS PLANNING. PERT Chart
- ERD | Entity Relationship Diagrams, ERD Software for Mac and Win
- Flowchart | Basic Flowchart Symbols and Meaning
- Flowchart | Flowchart Design - Symbols, Shapes, Stencils and Icons
- Flowchart | Flow Chart Symbols
- Electrical | Electrical Drawing - Wiring and Circuits Schematics
- Flowchart | Common Flowchart Symbols
- Flowchart | Common Flowchart Symbols