PERT Chart
A PERT (Program Evaluation Review Technique) Chart is a popular project management tool that is used to represent all tasks required to be performed for the successful project’s complete. This technique was developed to greatly simplify the planning and scheduling of complex projects. The large projects involve the phases consisting of numerous tasks, the tasks are usually of different types, there can be the parallel tasks among which are executed simultaneously and not dependent on the completion of other tasks. However, the most part of tasks depends on the execution of the rest and so must be completed in a certain sequence, which is clearly visible on a PERT Chart.
This type of charts is useful for scheduling, organizing, coordination and analyzing the project tasks with taking into account the time required for each task completion, as well as the minimal time required for finishing the whole project. PERT Charts are widely applied in the projects where time rather than cost is a major factor. They help diagram the workflows, project lifecycles, milestones, critical paths, schedules, timetables, the planning requirements for your project, to show the logical links between the tasks and the implementation plan for all activities along the critical path.
Pic 1. ConceptDraw PROJECT — PERT Chart
The set of ConceptDraw PROJECT isual reports helps you deliver the project information and to observe the project results in a suitable vivid way. To generate the visual diagram reports in ConceptDraw PROJECT, use the set of specialized buttons from the Project Diagrams section on the Reports toolbar at the program. The use of PERT Chart button lets generate a visual PERT chart report in a few seconds and without any efforts. This report will automatically open in ConceptDraw DIAGRAM application at the presentation mode and will include two pages: the page with PERT Chart for the current project and the page representing the legend for this PERT Chart. The PERT chart report generated for the multi-project will contain the set of PERT Charts for all projects from this multi-project.
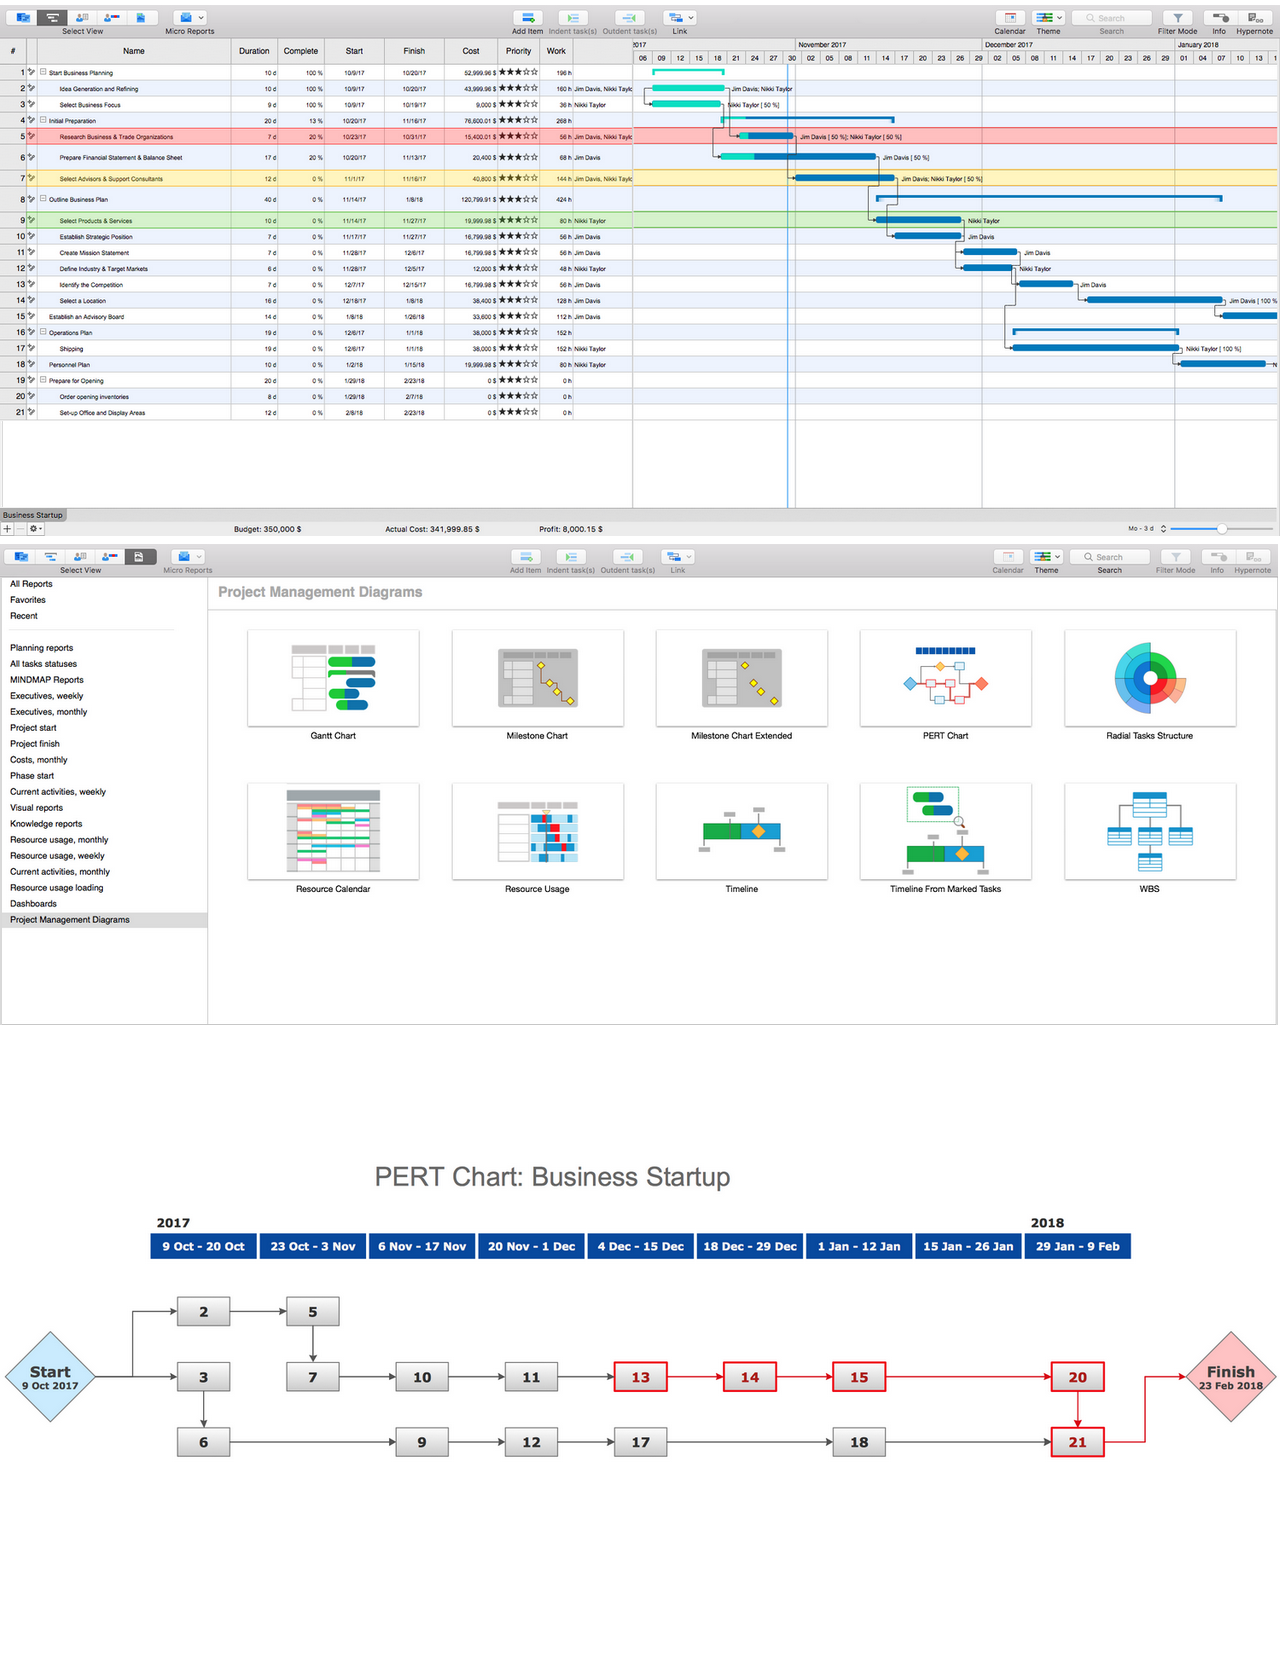
So, what does your PERT Chart look like in ConceptDraw DIAGRAM software? The start and finish of your project are marked with two big diamonds, milestones are displayed with small yellow diamonds, the tasks are represented by rectangles with numbers, these numbers correspond to the tasks numbers on the project Gantt Chart in ConceptDraw PROJECT application. The legend page contains the table of all project tasks with their order numbers at the project outline, the start and finish dates, and durations.