A KPI Dashboard

Sales Dashboards for Your Company

Ways You Can Visualize Sales Data

Data Visualization Software Solutions

 PM Dashboards
This solution extends ConceptDraw PRO and ConceptDraw PROJECT software with the ability to clearly display the identified key performance indicators for any project.
Data Visualization Solutions

Sales Dashboard Screenshot

 Business Productivity Area
Business Productivity Solutions extend ConceptDraw products with tools for making presentations, conducting meetings, preparing documents, brainstorming, or building new strategies.
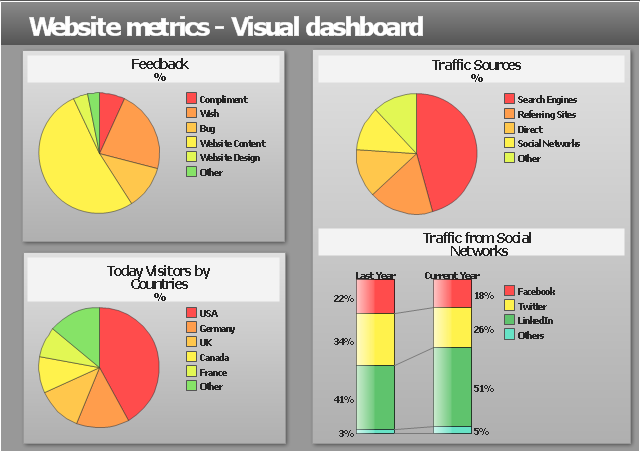
"Web analytics is the measurement, collection, analysis and reporting of internet data for purposes of understanding and optimizing web usage.
Web analytics is not just a tool for measuring web traffic but can be used as a tool for business and market research, and to assess and improve the effectiveness of a web site. Web analytics applications can also help companies measure the results of traditional print or broadcast advertising campaigns. It helps one to estimate how traffic to a website changes after the launch of a new advertising campaign. Web analytics provides information about the number of visitors to a website and the number of page views. It helps gauge traffic and popularity trends which is useful for market research.
There are two categories of web analytics; off-site and on-site web analytics.
Off-site web analytics refers to web measurement and analysis regardless of whether you own or maintain a website.
On-site web analytics measure a visitor's behavior once on your website. This includes its drivers and conversions; for example, the degree to which different landing pages are associated with online purchases. On-site web analytics measures the performance of your website in a commercial context. This data is typically compared against key performance indicators for performance, and used to improve a web site or marketing campaign's audience response." [Web analytics. Wikipedia]
The example "Website metrics - Visual dashboard" was created using the ConceptDraw PRO diagramming and vector drawing software extended with the Composition Dashboard solution from the area "What is a Dashboard" of ConceptDraw Solution Park.
www.conceptdraw.com/ solution-park/ composition-dashboard
Visual dashboard
 Project Management Area
Project Management area provides Toolbox solutions to support solving issues related to planning, tracking, milestones, events, resource usage, and other typical project management functions.
- A KPI Dashboard | A KPI Dashboard Provides the Answers Your ...
- Sales Dashboard Template | Sales KPI Dashboards | Visualize ...
- A KPI Dashboard
- Sales KPI Dashboards
- Sales Dashboards for Your Company | Frequency Distribution ...
- Constant improvement of key performance indicators | A KPI ...
- A KPI Dashboard | A KPI Dashboard Provides the Answers Your ...
- PM Dashboards | Meter Dashboard | A KPI Dashboard |
- A KPI Dashboard | Sales KPI Dashboards | A KPI Dashboard ...
- KPIs and Metrics | A KPI Dashboard | Sales KPI Dashboards |
- Sales KPI Dashboards | A KPI Dashboard | KPIs and Metrics |
- Sales KPI Dashboards
- A KPI Dashboard Provides the Answers Your Sales Team | Sales ...
- A KPI Dashboard Provides the Answers Your Sales Team | Sales ...
- A KPI Dashboard Provides the Answers Your Sales Team | How To ...
- Sales KPI Dashboards | A KPI Dashboard Provides the Answers ...
- PM Dashboards | A KPI Dashboard | Sales KPI Dashboards |
- Sales KPI Dashboards | A KPI Dashboard Provides the Answers ...
- Sales Dashboard | Sales Dashboard Examples | Visualize Sales ...
- Sales Dashboard - Access Anywhere | Sales Dashboards for Your ...
- ERD | Entity Relationship Diagrams, ERD Software for Mac and Win
- Flowchart | Basic Flowchart Symbols and Meaning
- Flowchart | Flowchart Design - Symbols, Shapes, Stencils and Icons
- Flowchart | Flow Chart Symbols
- Electrical | Electrical Drawing - Wiring and Circuits Schematics
- Flowchart | Common Flowchart Symbols
- Flowchart | Common Flowchart Symbols