Sales Dashboard - Access Anywhere
ConceptDraw Sales Dashboard is an automatically updated sales dashboard you can customize to see KPI you need. You can access sales dashboard anywhere to get fresh data and use any minute to see how your business can improve.Sales Dashboards for Your Company
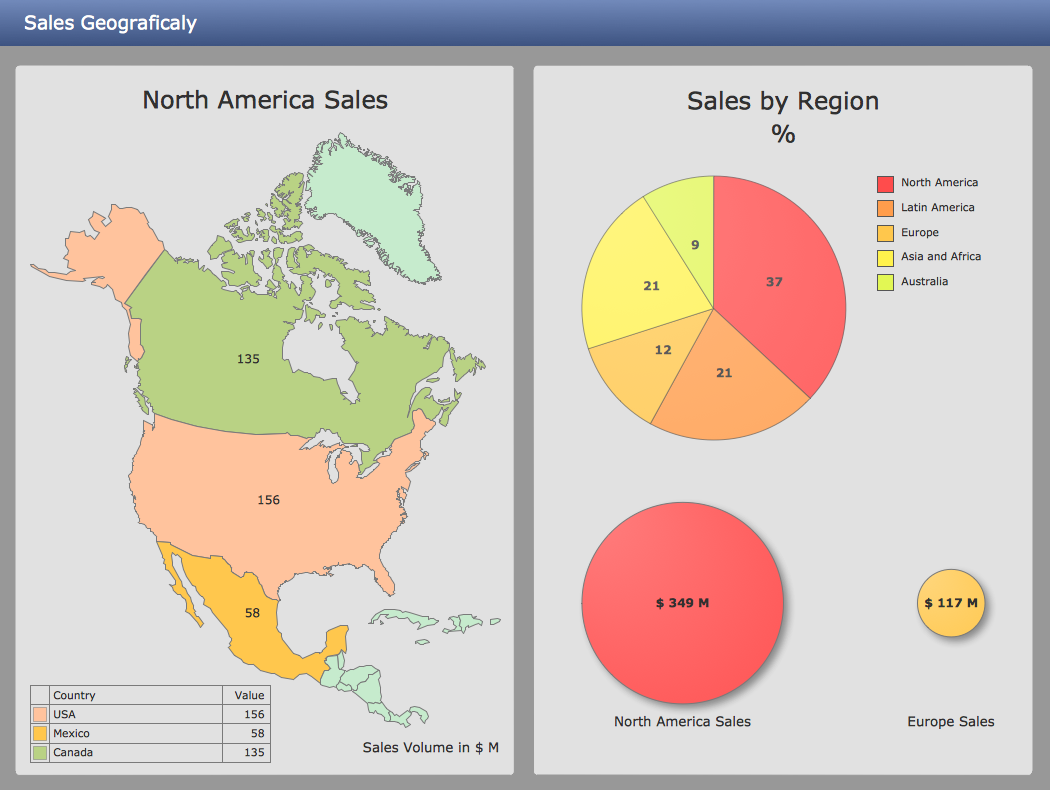
ConceptDraw PRO software extended with the Sales Dashboard solution allows you produce sales dashboards for your company easily. You can start from samples and templates delivered with the solution and then modify them to get a dashboard that suites your specific needs.Sales Dashboard Screenshot
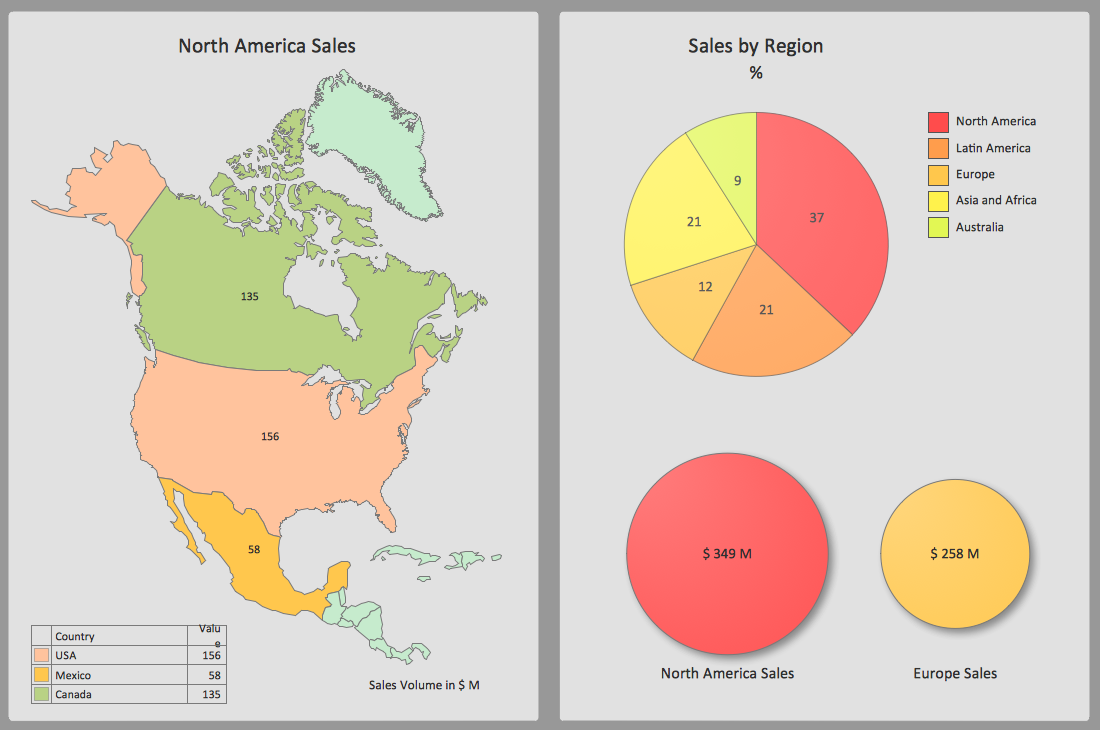
ConceptDraw PRO software exteneded with the Sales Dashboard solution is perfect for visualizing sales data. This is the best tool to analyse your sales perfornance and see how your business can improve.Business Intelligence Dashboard Software
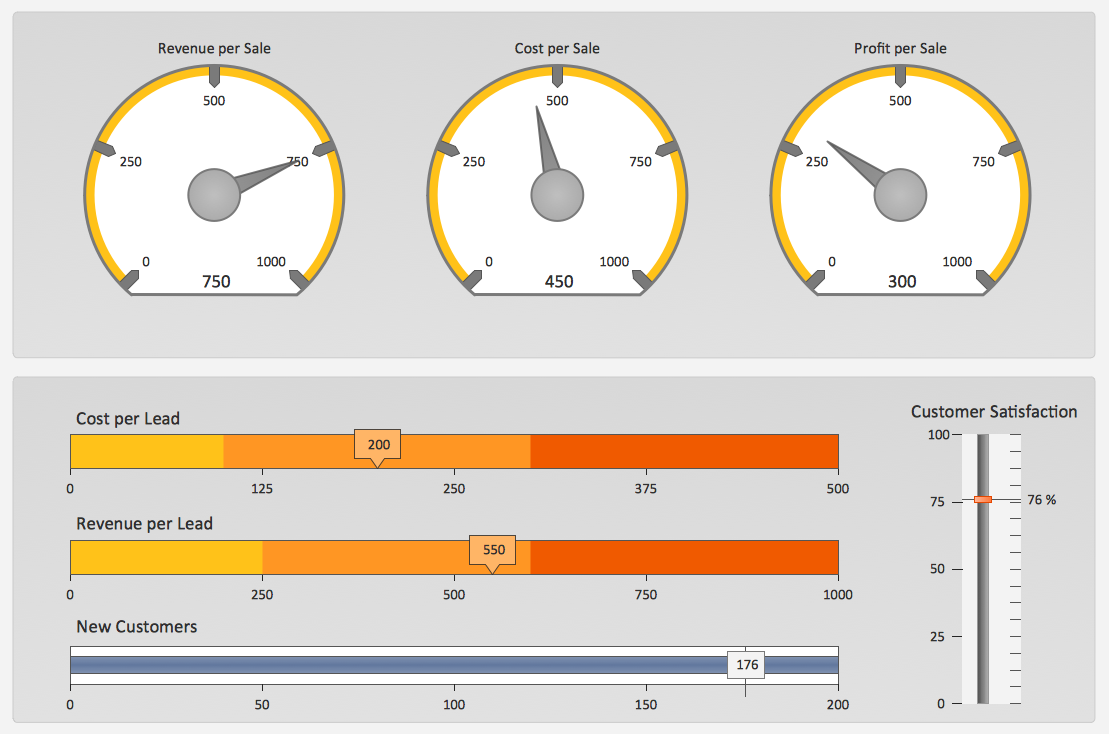
ConceptDraw PRO is a business intelligence dashboard software that allows you produce sales dashboard that suites your specific needs. To see how your business can improve with sales dashboards select KPI and start tracking it.
 PM Dashboards
This solution extends ConceptDraw PRO and ConceptDraw PROJECT software with the ability to clearly display the identified key performance indicators for any project.
Data Visualization Software Solutions
To see how your business can improve you can try data visualization software solutions that allows you visualize all your sales KPI in one sales dashboard allows you monitor and analyse sales activities.Data Visualization Solutions
Data visualization solutions help you to see how your business can improve. Visualizing sales data using ConceptDraw Sales Dashboard gives you a bird's-eye view of the sale process.A KPI Dashboard
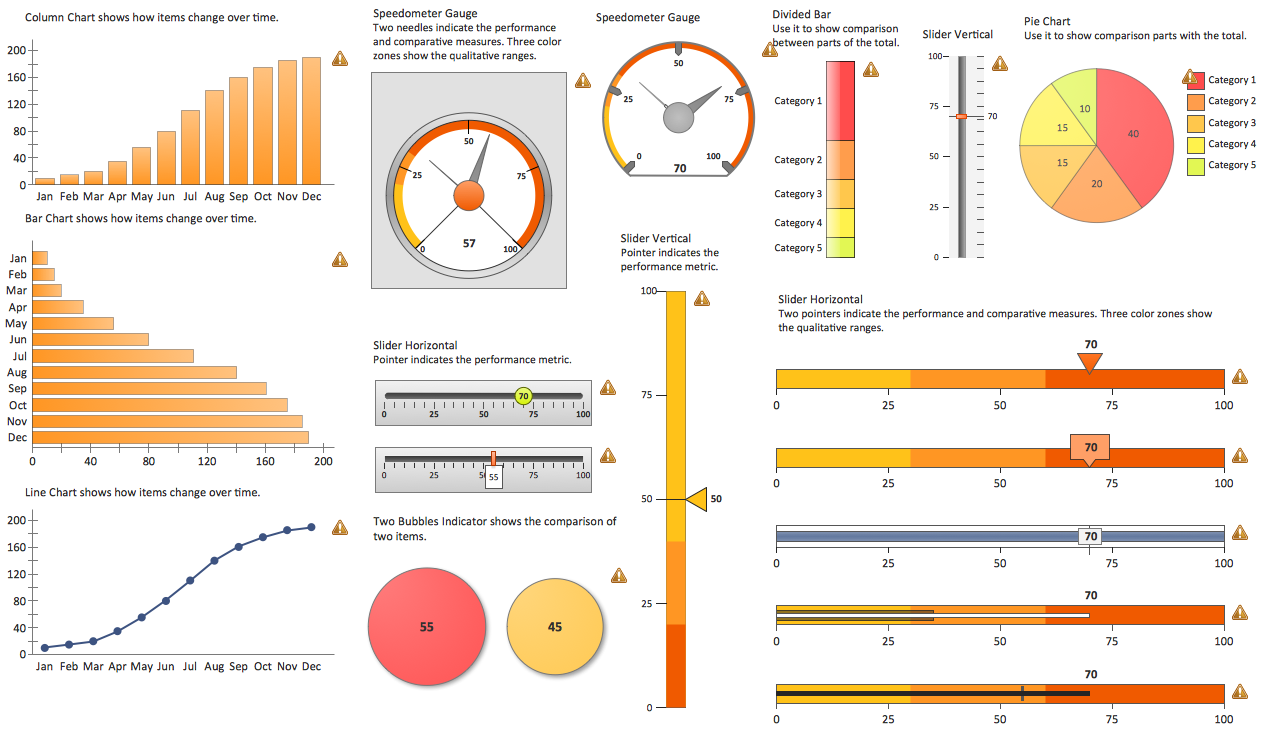
Composing a dashboard from different KPI is a kind of art. Visualizing sales data you have to keep balance to keep your dashboard informative, not messy. ConceptDraw Sales Dashboard solution gives you a set of good examples of balanced dashboards.Ways You Can Visualize Sales Data
There are lots of ways you can visualize sales data, and the simplest way is using ConceptDraw Sales Dashboard solution for ConceptDraw PRO. You just need to connect your data to one of pre-designed dashboards, and then you can see dynamic picture of changes.
 ConceptDraw Solution Park
ConceptDraw Solution Park collects graphic extensions, examples and learning materials
 Business Productivity Area
Business Productivity Solutions extend ConceptDraw products with tools for making presentations, conducting meetings, preparing documents, brainstorming, or building new strategies.
 Project Management Area
Project Management area provides Toolbox solutions to support solving issues related to planning, tracking, milestones, events, resource usage, and other typical project management functions.
- Constant improvement of key performance indicators | A KPI ...
- A KPI Dashboard | A KPI Dashboard Provides the Answers Your ...
- Sales Dashboard - Access Anywhere | Sales Dashboard Template ...
- A KPI Dashboard
- Sales KPI Dashboards
- Sales Performance
- A KPI Dashboard | A KPI Dashboard Provides the Answers Your ...
- Sales Performance | PM Dashboards | Sales Dashboard Solutions ...
- Sales Dashboard Template | Sales KPI Dashboards | Visualize ...
- Business Graphics Software | Data Visualization Software Solutions ...
- Business Intelligence Dashboard Software | Meter Dashboard ...
- How To Create Project Report | PM Dashboards | Customer ...
- How to Collaborate in Business via Skype | Online Collaboration via ...
- PM Dashboards | Meter Dashboard | A KPI Dashboard |
- A KPI Dashboard | A KPI Dashboard Provides the Answers Your ...
- Status Dashboard | Meter Dashboard | Sales Dashboard |
- Sales KPI Dashboards | A KPI Dashboard Provides the Answers ...
- A KPI Dashboard Provides the Answers Your Sales Team | Sales ...
- Sales Dashboard | Sales Dashboard Template | Empower Your ...
- Sales KPI Dashboards | A KPI Dashboard | KPIs and Metrics |


