Sales Dashboard Solutions can help your sales team keep an eye on performance
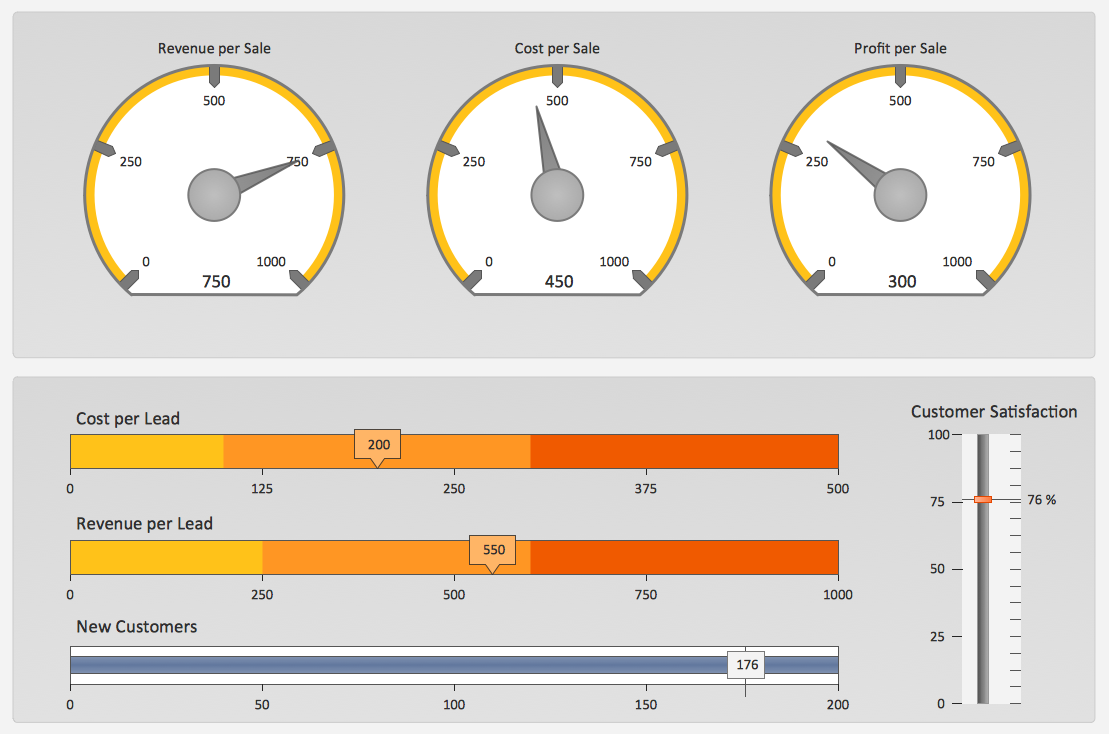
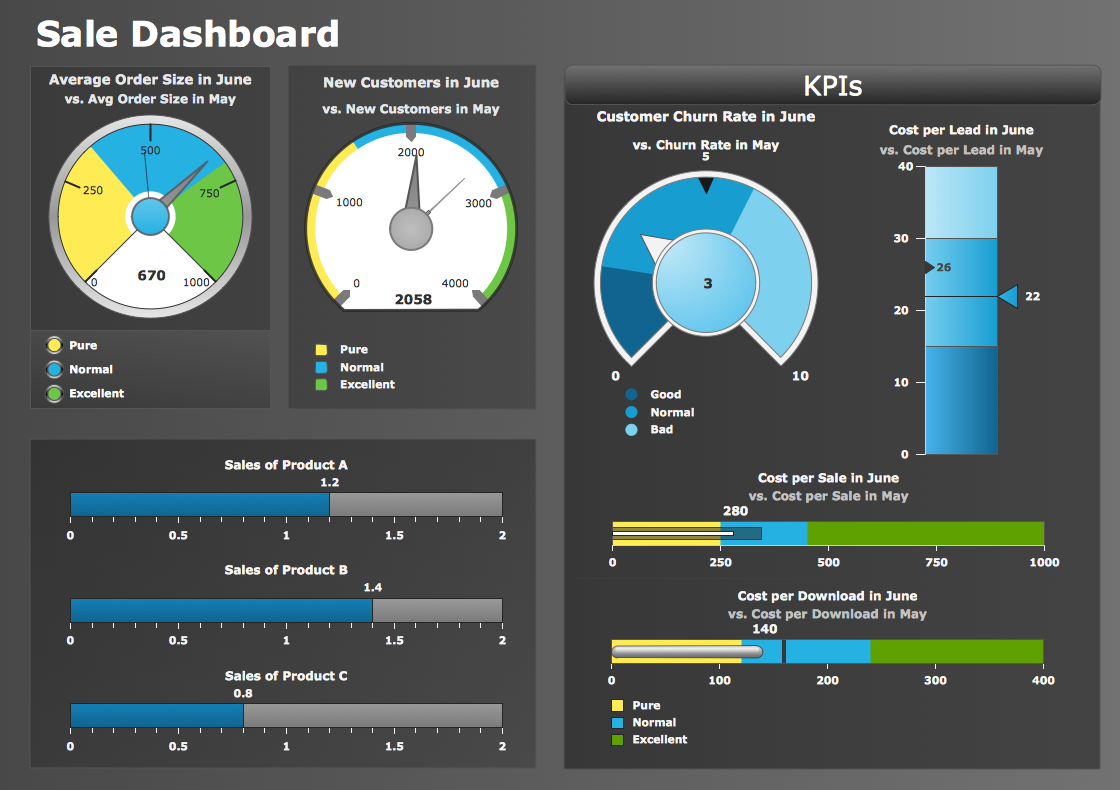
ConceptDraw Sales Dashboard Solution is a simple and effective way of visualizing sales data and get clear picture of your sales process to see how your business can improve.A KPI Dashboard Provides the Answers Your Sales Team
Sales dashboard is a tool that provides the answers to all questions your sales team may have. A mature sales dashboard provides complete set of KPI to shows corporate, team or personal performance to keep sales process clear.Sales Performance
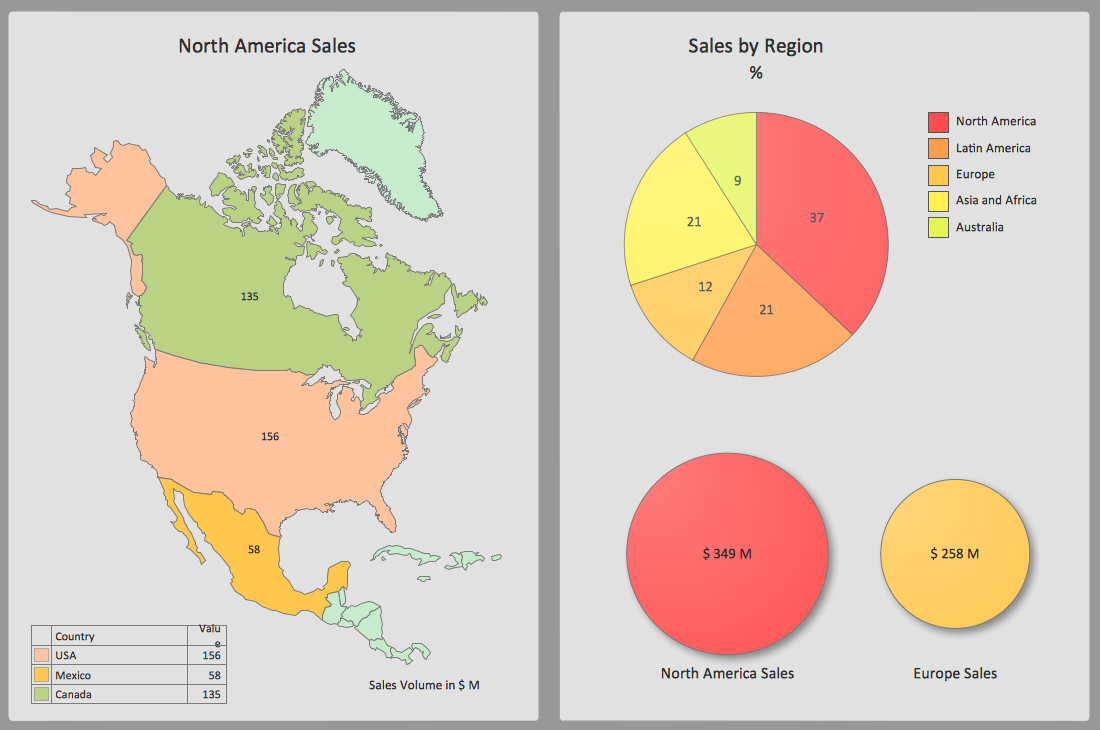
Measuring sales performance is key task to see how your business can improve. Visualizing sales data with ConceptDraw Sales Dashboard you get a clear picture of sales performance.Empower Your Sales Team With a Sales Dashboard
ConceptDraw Sales Dashboard solution allows you empower your sales team with a sales dashboard that visualizes all team and personal KPI your team need to work effectively.Sales Dashboard Examples
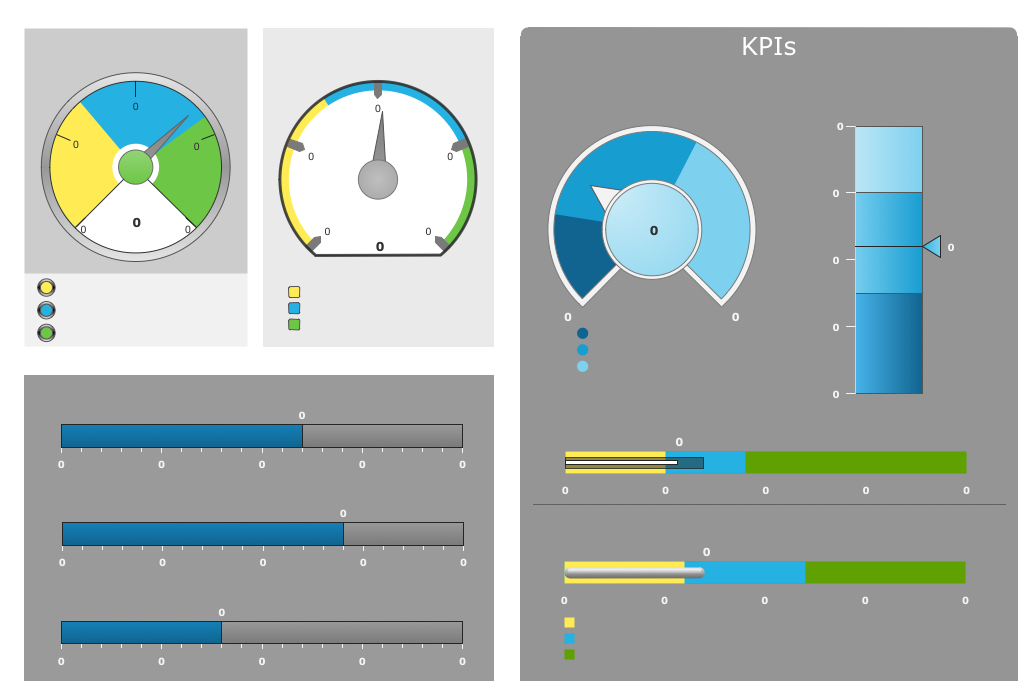
Visualizing sales data you may need a good example to start. ConceptDraw Sales Dashboard solution delivers a complete set of templates and samples you can use as examples to start composing your own sales dashboard.
 Sales Dashboard
Sales Dashboard solution extends ConceptDraw PRO software with templates, samples and library of vector stencils for drawing the visual dashboards of sale metrics and key performance indicators (KPI).
Sales Teams are Inherently Competitive
Sales teams are inherently competitive, so you don't need to invent extra ways to stimulate the competition. At the same time, you can provide the team with a sales dashboard shows company, team and personal KPI to make the competition clear.Data Visualization Solutions
Data visualization solutions help you to see how your business can improve. Visualizing sales data using ConceptDraw Sales Dashboard gives you a bird's-eye view of the sale process.
 Correlation Dashboard
Correlation dashboard solution extends ConceptDraw PRO software with samples, templates and vector stencils library with Scatter Plot Charts for drawing the visual dashboard visualizing data correlation.
 Composition Dashboard
Composition dashboard solution extends ConceptDraw PRO software with templates, samples and vector stencils library with charts and indicators for drawing visual dashboards showing data composition.
 PM Dashboards
This solution extends ConceptDraw PRO and ConceptDraw PROJECT software with the ability to clearly display the identified key performance indicators for any project.
 Time Series Dashboard
Time series dashboard solution extends ConceptDraw PRO software with templates, samples and vector stencils libraries with charts, graphs and plots for drawing the visual dashboards showing data time series.
 Business Productivity Area
Business Productivity Solutions extend ConceptDraw products with tools for making presentations, conducting meetings, preparing documents, brainstorming, or building new strategies.
 Comparison Dashboard
Comparison dashboard solution extends ConceptDraw PRO software with samples, templates and vector stencils library with charts and indicators for drawing the visual dashboard comparing data.
- Sales Performance | PM Dashboards | Sales Dashboard Solutions ...
- Sales Dashboard - Access Anywhere | Sales Dashboard Template ...
- A KPI Dashboard | A KPI Dashboard Provides the Answers Your ...
- Sales KPI Dashboards
- A KPI Dashboard | Sales KPI Dashboards | Sales Dashboard ...
- A KPI Dashboard | A KPI Dashboard Provides the Answers Your ...
- Sales KPI Dashboards | A KPI Dashboard Provides the Answers ...
- A KPI Dashboard Provides the Answers Your Sales Team | Sales ...
- A KPI Dashboard | A KPI Dashboard Provides the Answers Your ...
- Constant improvement of key performance indicators | A KPI ...
- Sales Dashboard | Sales Dashboard Template | Empower Your ...
- Marketing | How to Deliver Presentations using Mind Maps | Sales ...
- A KPI Dashboard Provides the Answers Your Sales Team
- Sales Dashboard Template | Sales KPI Dashboards | Visualize ...
- Sales Dashboard Template | Sales Dashboard Examples | Sales ...
- A KPI Dashboard | A KPI Dashboard Provides the Answers Your ...
- Status Dashboard | Meter Dashboard | Sales Dashboard |
- How To Create Project Report | PM Dashboards | Customer ...
- Status Dashboard | Sales Dashboard Examples | Sales Dashboard ...
- Online Collaboration via Skype | Seven Management and Planning ...


