HelpDesk
How to Draw a Scatter Diagram

Scatter Plot

Scatter Plot Graph

Scatter Chart Examples

Scatter Graph

Make a Scatter Plot

Scatter Graph Charting Software

Blank Scatter Plot

Scatter Chart Analysis. Scatter Chart Example

Scatter Chart

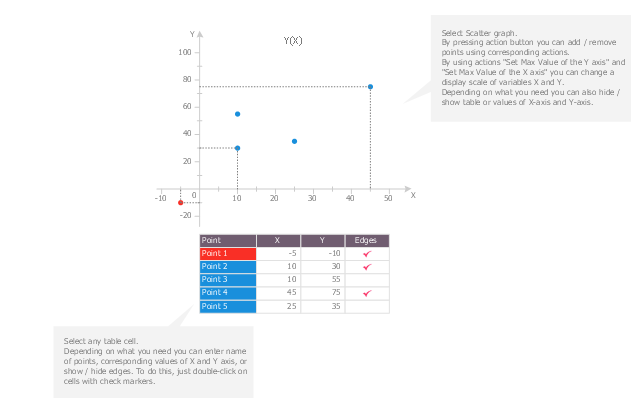
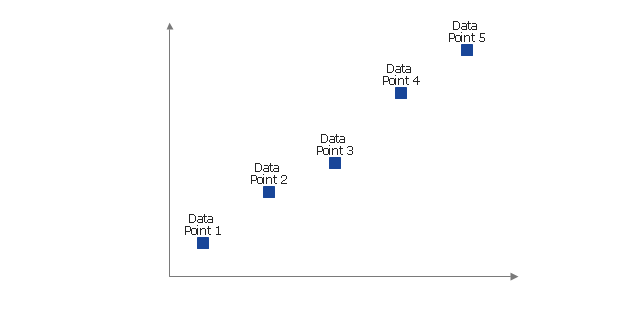
Use this scatter plot template to show values for two variables for your data series in ConceptDraw PRO diagramming and vector drawing software.
"A scatter plot, scatterplot, or scattergraph is a type of mathematical diagram using Cartesian coordinates to display values for two variables for a set of data.
The data is displayed as a collection of points, each having the value of one variable determining the position on the horizontal axis and the value of the other variable determining the position on the vertical axis. This kind of plot is also called a scatter chart, scattergram, scatter diagram, or scatter graph." [Scatter plot. Wikipedia]
The chart template "Scatter graph" is included in the Basic Scatter Diagrams solution from the Graphs and Charts area of ConceptDraw Solution Park.
Template
 Scatter Diagrams
The Scatter Diagrams solution extends ConceptDraw DIAGRAM functionality with templates, samples, and a library of vector stencils that make construction of a Scatter Plot easy. The Scatter Chart Solution makes it easy to design attractive Scatter Diagrams used in various fields of science, work, and life activities. ConceptDraw DIAGRAM lets you enter the data to the table and construct the Scatter Plot Graph automatically according to these data.
This scatter graphs (scattergraph. scatter chart, scatter plot, scatterplot, scatter diagram) sample show how the scatter plot with missing categories on the left,
the growth appears to be more linear with less variation. It was designed on the base of the Wikimedia Commons files: Scatter Plot with missing categories.svg [commons.wikimedia.org/ wiki/ File:Scatter_ Plot_ with_ missing_ categories.svg], and A scatter plot without missing categories.svg [commons.wikimedia.org/ wiki/ File:A_ scatter_ plot_ without_ missing_ categories.svg].
This file is available under the Creative Commons CC0 1.0 Universal Public Domain Dedication. [creativecommons.org/ publicdomain/ zero/ 1.0/ deed.en]
"In statistics, a misleading graph, also known as a distorted graph, is a graph that misrepresents data, constituting a misuse of statistics and with the result that an incorrect conclusion may be derived from it.
Graphs may be misleading through being excessively complex or poorly constructed. Even when constructed to accurately display the characteristics of their data, graphs can be subject to different interpretation. ...
Graphs created with omitted data remove information from which to base a conclusion. ...
In financial reports, negative returns or data that do not correlate a positive outlook may be excluded to create a more favorable visual impression." [Misleading graph. Wikipedia]
The chart example "Scatter plot with missing categories" was created using the ConceptDraw PRO diagramming and vector drawing software extended with the Scatter Diagrams solution from the Graphs and Charts area of ConceptDraw Solution Park.
Scatter chart

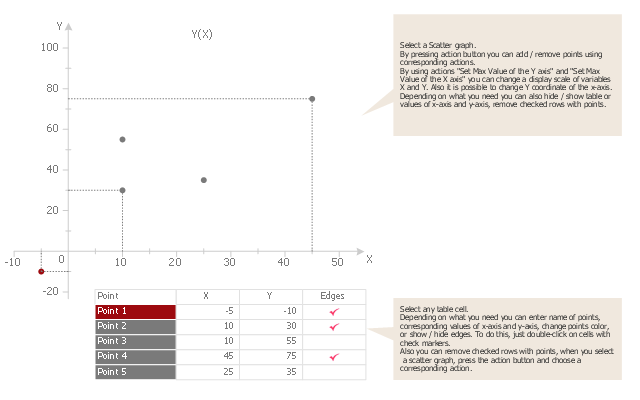
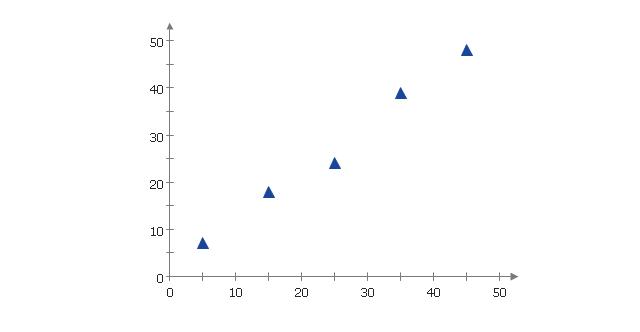
Use this template to design your scatter charts.
"A scatter plot, scatterplot, or scattergraph is a type of mathematical diagram using Cartesian coordinates to display values for two variables for a set of data.
The data is displayed as a collection of points, each having the value of one variable determining the position on the horizontal axis and the value of the other variable determining the position on the vertical axis. This kind of plot is also called a scatter chart, scattergram, scatter diagram, or scatter graph." [Scatter plot. Wikipedia]
The template "Scatter graph" for the ConceptDraw PRO diagramming and vector drawing software is included in the Scatter Diagrams solution from the Graphs and Charts area of ConceptDraw Solution Park.
Template
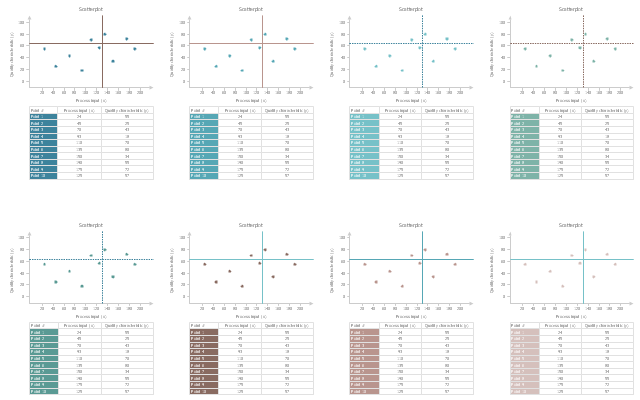
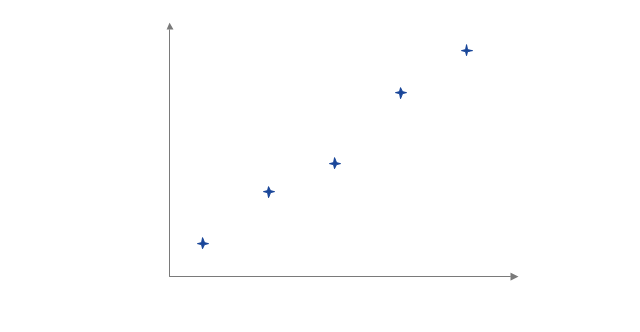
The vector stencils library "Scatterplot" contains 8 scatter diagram templates.
Use to design your scatter graphs with ConceptDraw PRO diagramming and vector drawing software.
"A scatter plot, scatterplot, or scattergraph is a type of mathematical diagram using Cartesian coordinates to display values for typically two variables for a set of data. If the points are color-coded you can increase the number of displayed variables to three.
The data is displayed as a collection of points, each having the value of one variable determining the position on the horizontal axis and the value of the other variable determining the position on the vertical axis. This kind of plot is also called a scatter chart, scattergram, scatter diagram, or scatter graph. ...
The scatter diagram is one of the seven basic tools of quality control." [Scatter plot. Wikipedia]
The example of scatter chart templates "Design elements - Scatterplot" is included in the Seven Basic Tools of Quality solution from the Quality area of ConceptDraw Solution Park.
Scatter graph templates
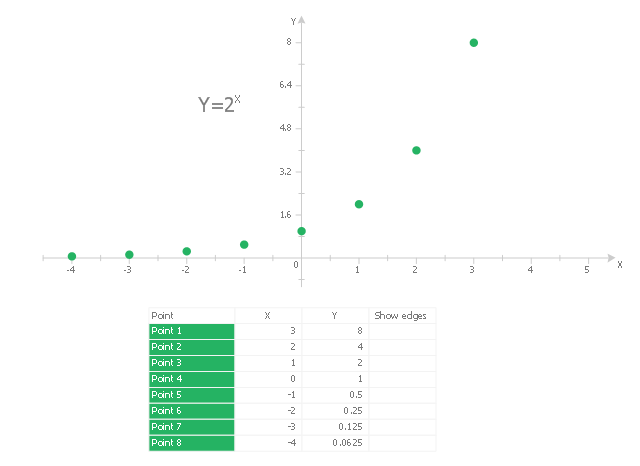
This scatter graph (scattergraph. scatter chart, scatter plot, scatterplot, scatter diagram) example visualizes exponent function.
"Exponentiation is a mathematical operation, written as bn, involving two numbers, the base b and the exponent (or power) n. When n is a positive integer, exponentiation corresponds to repeated multiplication; in other words, a product of n factors, each of which is equal to b (the product itself can also be called power)...
Exponentiation is used pervasively in many other fields, including economics, biology, chemistry, physics, as well as computer science, with applications such as compound interest, population growth, chemical reaction kinetics, wave behavior, and public-key cryptography. ...
Graphs of y = bx... Each curve passes through the point (0, 1) because any nonzero number raised to the power of 0 is 1. At x = 1, the value of y equals the base because any number raised to the power of 1 is the number itself." [Wikipedia. Exponentiation]
The scatter graph example "2^x Function" was created using the ConceptDraw PRO diagramming and vector drawing software extended with the Scatter Diagrams solution from the Graphs and Charts area of ConceptDraw Solution Park.
Scatter chart
The vector stencils library Correlation charts from the Corellation Dashboard solution contains 4 templates of scatter plots for drawing the visual dashboards using the ConceptDraw PRO diagramming and vector drawing software.
"A scatter plot, scatterplot, or scattergraph is a type of mathematical diagram using Cartesian coordinates to display values for two variables for a set of data.
The data is displayed as a collection of points, each having the value of one variable determining the position on the horizontal axis and the value of the other variable determining the position on the vertical axis. This kind of plot is also called a scatter chart, scattergram, scatter diagram, or scatter graph." [Scatter plot. Wikipedia]
The example "Design elements - Correlation charts" is included in the Corellation Dashboard solution from the area "What is a Dashboard" of ConceptDraw Solution Park.
Scatter graphs

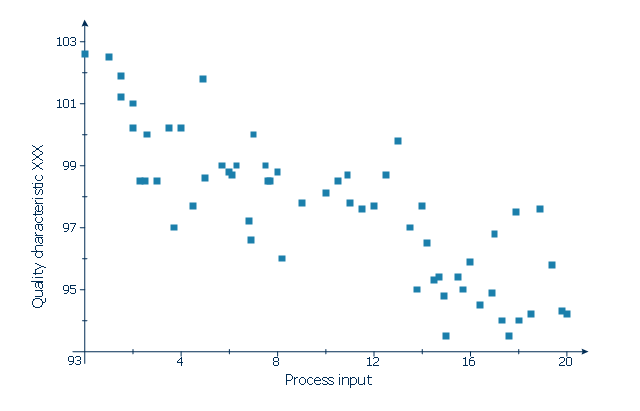
This scatter graph (scattergraph. scatter chart, scatter plot, scatterplot, scatter diagram) example depicts quality characteristic vs. process input. It was designed on the base of the Wikimedia Commons file: Scatter diagram for quality characteristic XXX.svg. [commons.wikimedia.org/ wiki/ File:Scatter_ diagram_ for_ quality_ characteristic_ XXX.svg]
This file is licensed under the Creative Commons Attribution-Share Alike 3.0 Unported license. [creativecommons.org/ licenses/ by-sa/ 3.0/ deed.en]
"Scatterplots are used to graphically display the relationship between two variables. They are commonly used to accompany correlational analyses." [Scatterplot. Wikiversity]
The scatter chart example "Quality characteristic XXX" was created using the ConceptDraw PRO diagramming and vector drawing software extended with the Scatter Diagrams solution from the Graphs and Charts area of ConceptDraw Solution Park.
Scatter chart
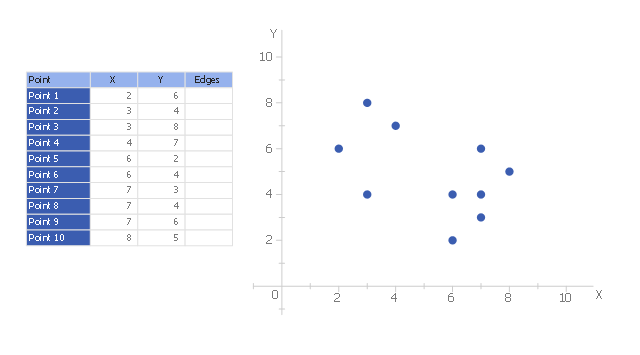
This scatter plot sample is used to illustrate the k-medoid clustering algorithm.
"The k-medoids algorithm is a clustering algorithm related to the k-means algorithm and the medoidshift algorithm. Both the k-means and k-medoids algorithms are partitional (breaking the dataset up into groups) and both attempt to minimize the distance between points labeled to be in a cluster and a point designated as the center of that cluster." [en.wikipedia.org/ wiki/ K-medoids]
The scatterplot example "k-Medoid clustering" was created using the ConceptDraw PRO diagramming and vector drawing software extended with the Basic Scatter Diagrams solution from the Graphs and Charts area of ConceptDraw Solution Park.
Scatterplot
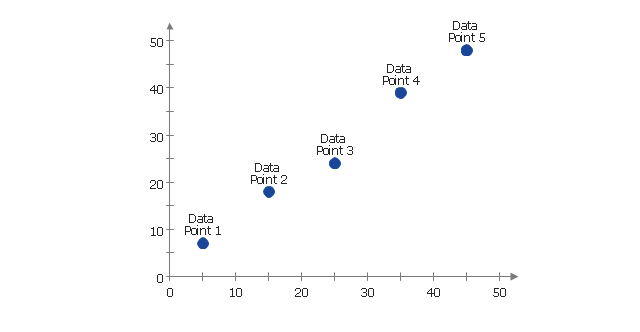
The vector stencils library "Correlation charts" contains 4 scatter plot templates.
These scatterplots are Live Objects showing the relationship between two data sets from data source files.
User sets the data source file in Action menu of each scatter plot.
The scatter graphs example "Correlation charts - Vector stencils library" was created using the ConceptDraw PRO diagramming and vector drawing software extended with the Corellation Dashboard solution from the area "What is a Dashboard" of ConceptDraw Solution Park.
Scatter Plot 1
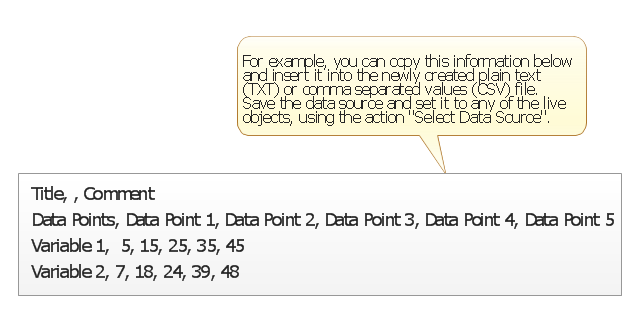
Data source file example
Scatter Plot 2
Scatter Plot 3
Scatter Plot 4
- Basic Diagramming | Line Graph | Bar Graph | Scatter Plot On Us ...
- Scatter Diagrams | Best Diagramming | Scatter Graph | Mind Map ...
- Scatter Diagrams | Blank Scatter Plot | How to Draw a Scatter ...
- Scatter Diagrams | Blank Scatter Plot | Scatter Chart Examples ...
- Scatter Chart Examples | Scatter Diagrams | How to Draw a Scatter ...
- Scatter Graph Charting Software | Scatter Diagrams | How to Draw a ...
- Scatter Graph Charting Software | Scatter Chart | Scatter Diagram ...
- Scatter Diagram In Total Quality Management
- Scatter Diagrams | How to Draw a Scatter Diagram Using ...
- Baby Age And Height Scatter Plot
- Scatter Plot | Design elements - Scatterplot | Blank Scatter Plot ...
- Scatter Graph Charting Software | Scatter Chart Examples | Scatter ...
- Scatter Chart Examples | Scatter Diagram | Blank Scatter Plot ...
- Scatter Diagram In Tqm
- Scatter Chart Examples | Blank Scatter Plot | Scatter Plot | Scatter ...
- Scatter Graph Charting Software | Scatter Plot Graph | Scatter Chart ...
- Scatter Chart Examples | Bubble Plot | Four Dimensions Bubble Plot ...
- Blank Scatter Plot | Scatter Chart Examples | Scatter Plot | How To ...
- Design elements - Marketing charts | Scatter Chart Examples ...