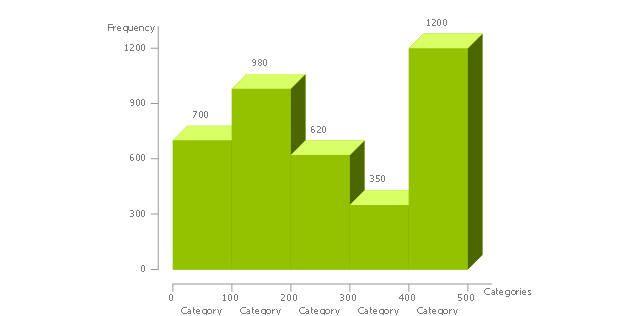
Histogram Chart

Seven Basic Tools of Quality - Histogram

ConceptDraw PRO diagramming and vector drawing software offers a powerful Seven Basic Tools of Quality solution from the Quality area of ConceptDraw Solution Park which contains a set of useful tools for easy drawing Histogram and other quality related diagrams of any complexity.
HelpDesk
How to Draw a Histogram in ConceptDraw PRO

How Do You Make a Histogram?

Make a Histogram

Histogram

Making a Histogram

How To Make a Histogram?

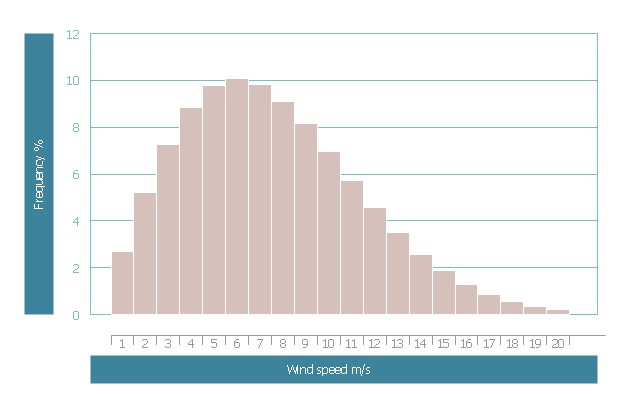
This wind speed frequency distribution histogram example was redesigned from the Wikimedia Commons file: Frekvensfördelning.jpg.
[commons.wikimedia.org/ wiki/ File:Frekvensf%C3%B6rdelning.jpg]
This file is licensed under the Creative Commons Attribution-Share Alike 3.0 Unported license. [creativecommons.org/ licenses/ by-sa/ 3.0/ deed.en]
Example of frequency distribution of wind speed. Each bar represents the range of 1 m / s. Over 10 percent of the time the wind blows from 5.5 to 6.5 m / s, which is the most common wind speed. The mean wind speed is 7 m / s. [Vindkraft. Swedish Wikipedia]
The example "Wind speed histogram" was created using the ConceptDraw PRO software extended with the Seven Basic Tools of Quality solution from the Quality area of ConceptDraw Solution Park.
Histogram example
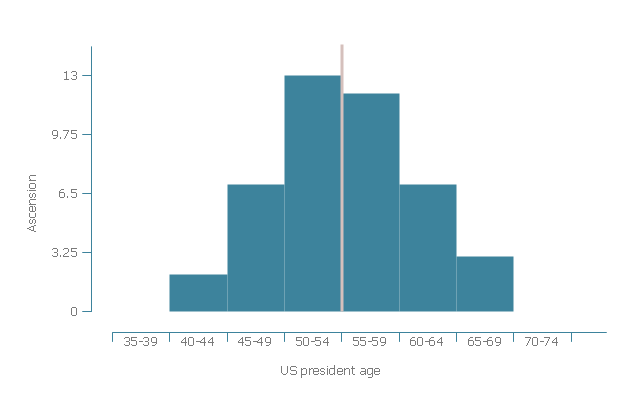
This histogram example was redesigned from the Wikimedia Commons file: Age of presidental ascention.jpg.
"Age of US president at date of ascension to office in five-year age groups."
[commons.wikimedia.org/ wiki/ File:Age_ of_ presidental_ ascention.jpg]
This file is licensed under the Creative Commons Attribution-Share Alike 3.0 Unported license. [creativecommons.org/ licenses/ by-sa/ 3.0/ deed.en]
"Age of presidents when assuming office approximately follows a bell curve (mean age marked by red line, c. 55 years)" [List of Presidents of the United States by age. Wikipedia]
The histogram example "Age of presidential ascension" was created using the ConceptDraw PRO software extended with the Seven Basic Tools of Quality solution from the Quality area of ConceptDraw Solution Park.
Histogram
How To Make Histogram in ConceptDraw PRO?

How To Draw a Histogram?

 Basic Histograms
This solution extends the capabilities of ConceptDraw PRO v10.3.0 (or later) with templates, samples and a library of vector stencils for drawing Histograms.
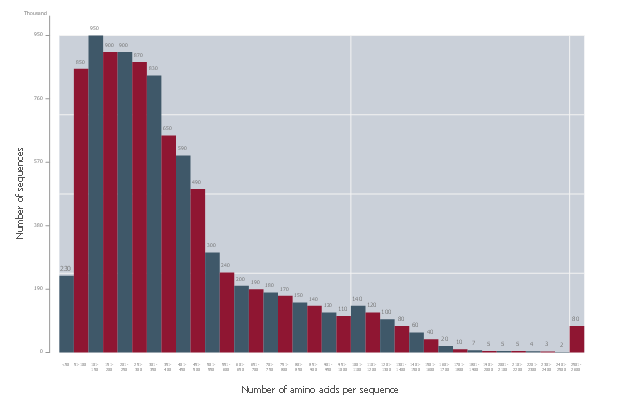
"Proteins are large biological molecules, or macromolecules, consisting of one or more chains of amino acid residues. Proteins perform a vast array of functions within living organisms, including catalyzing metabolic reactions, replicating DNA, responding to stimuli, and transporting molecules from one location to another. Proteins differ from one another primarily in their sequence of amino acids, which is dictated by the nucleotide sequence of their genes, and which usually results in folding of the protein into a specific three-dimensional structure that determines its activity.
A polypeptide is a single linear polymer chain derived from the condensation of amino acids. The individual amino acid residues are bonded together by peptide bonds and adjacent amino acid residues. The sequence of amino acid residues in a protein is defined by the sequence of a gene, which is encoded in the genetic code." [Protein. Wikipedia]
This histogram sample was redesigned from the Wikimedia Commons file: AminoAcid length distribution 2010.svg. [commons.wikimedia.org/ wiki/ File:AminoAcid_ length_ distribution_ 2010.svg]
The histogram example "Amino acid length distribution" was created using the ConceptDraw PRO diagramming and vector drawing software extended with the Histograms solution from the Graphs and Charts area of ConceptDraw Solution Park.
Histogram
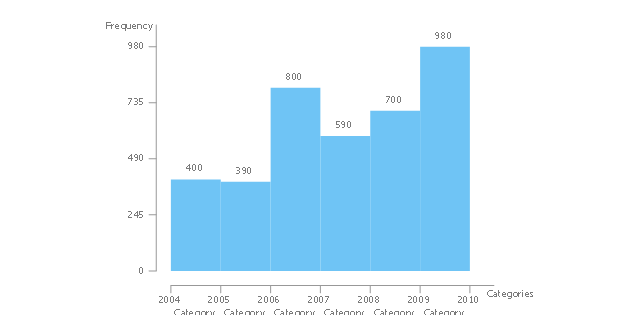
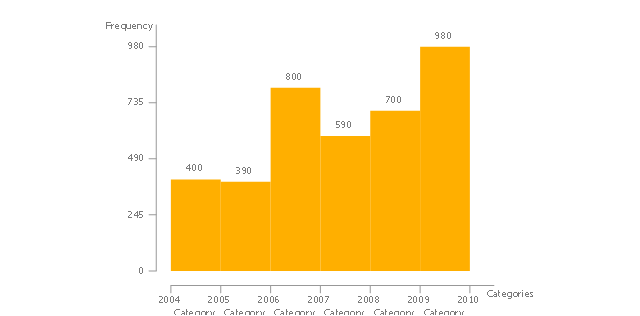
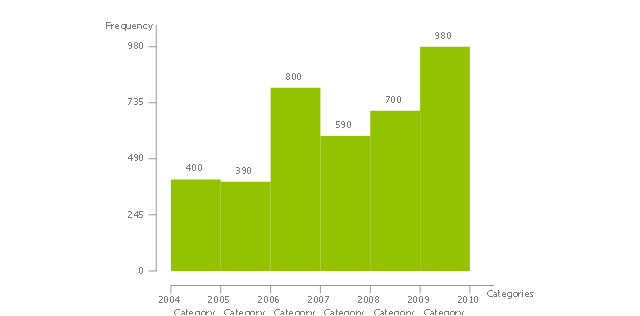
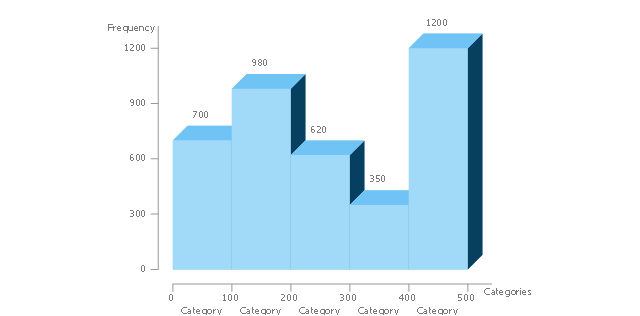
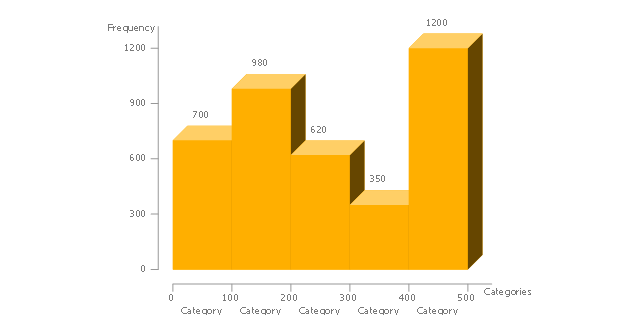
The vector stencils library "Histograms" contains 8 templates of histograms for visualizing frequency distribution data.
Drag a template from the library to your document and enter your data.
Use these shapes to draw your histograms in ConceptDraw PRO diagramming and vector drawing software.
The vector stencils library "Histograms" is included in the Histograms solution from the Graphs and Charts area of ConceptDraw Solution Park.
Frequency histogram
Frequency histogram 2
Frequency histogram 3
Frequency histogram (table)
-histograms---vector-stencils-library.png--diagram-flowchart-example.png)
3D frequency histogram
3D frequency histogram 2
3D frequency histogram 3
3D frequency histogram (table)
-histograms---vector-stencils-library.png--diagram-flowchart-example.png)
- Seven Basic Tools of Quality - Histogram | Histograms | Basic ...
- Histogram Chart | How Do You Make a Histogram ? | Make a ...
- Seven Basic Tools of Quality - Histogram | Histogram | How To Make ...
- Histograms - Vector stencils library | Frequency distribution ...
- Seven Basic Tools of Quality - Histogram | Histogram | How Do You ...
- Seven Basic Tools of Quality - Histogram | How to Draw a Histogram ...
- Histogram Chart | Histogram | Make a Histogram | Bar Graph Vs ...
- Making a Histogram | How To Make a Histogram ? | Chart Examples ...
- Histogram Chart | Histogram | Making a Histogram | Histogram Chart
- Histogram | Basic Diagramming | Pie Chart Software | Histograms ...
- Histogram Pie Chart
- How Do You Make a Histogram ? | Projects HR dashboard | Seven ...
- How to Draw a Histogram in ConceptDraw PRO | Education charts ...
- Histograms | Histogram Chart | How to Draw a Histogram in ...
- Histogram - Template | Normal distribution graph - Template ...
- Beetles in the river Thames - Frequency histogram | Preston
- Histograms | Chart Examples | Bar Chart | Histogram Languages ...
- Histograms Bar Graphs Software For Windows
- How to Draw a Histogram in ConceptDraw PRO | Histogram Chart ...
- How to Draw a Histogram in ConceptDraw PRO | How Do You Make ...
- ERD | Entity Relationship Diagrams, ERD Software for Mac and Win
- Flowchart | Basic Flowchart Symbols and Meaning
- Flowchart | Flowchart Design - Symbols, Shapes, Stencils and Icons
- Flowchart | Flow Chart Symbols
- Electrical | Electrical Drawing - Wiring and Circuits Schematics
- Flowchart | Common Flowchart Symbols
- Flowchart | Common Flowchart Symbols