Pyramid Diagram

five level pyramid example is included in the Pyramid Diagrams solution from Marketing area of ConceptDraw Solution Park.
Pyramid Diagram

Pyramid Diagram

Why Flowchart Important to Accounting Information System?

Flowcharts are used to represent accounting information in a system. There are special symbols which are used to create accounting flowcharts. Try conceptdraw flowcharting set of symbols to draw a professional charts.
Helpful in all stages of quality management

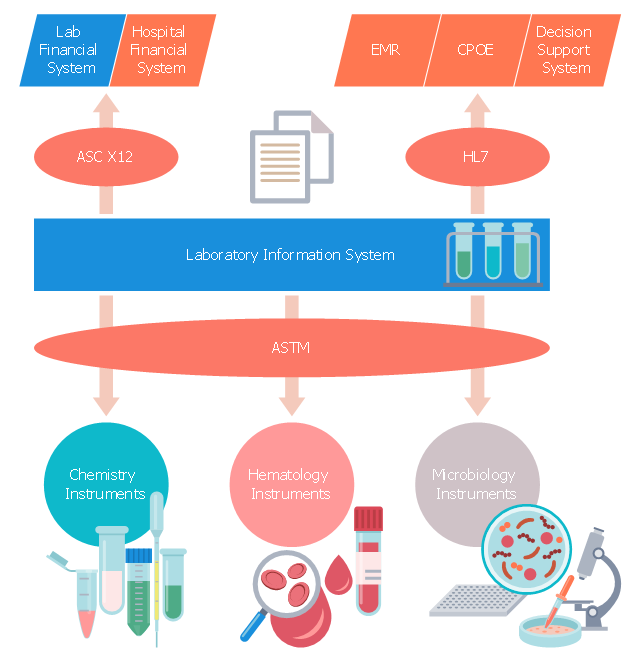
This medical flow chart sample shows logical connections to/ from laboratory information system (LIS) within the hospital.
It was drawn on the base of Wikimedia Commons file: WithinHospital.jpg. [commons.wikimedia.org/ wiki/ File:WithinHospital.jpg]
This file is licensed under the Creative Commons Attribution-Share Alike 3.0 Unported license. [creativecommons.org/ licenses/ by-sa/ 3.0/ deed.en]
"A laboratory information management system (LIMS), sometimes referred to as a laboratory information system (LIS) or laboratory management system (LMS), is a software-based laboratory and information management system with features that support a modern laboratory's operations. Key features include — but are not limited to — workflow and data tracking support, flexible architecture, and data exchange interfaces, which fully "support its use in regulated environments". The features and uses of a LIMS have evolved over the years from simple sample tracking to an enterprise resource planning tool that manages multiple aspects of laboratory informatics." [Laboratory information management system. Wikipedia]
The medical flowchart example "Laboratory Information System within the hospital" was designed using ConceptDraw PRO software extended with Healthcare Workflow Diagrams solution from Business Processes area of ConceptDraw Solution Park.
Medical flowchart
How to Create Flowcharts for an Accounting Information System

Flowcharts help users of Accounting Information System to understand the step sequences of accounting processes. Use ConceptDraw DIAGRAM with Accounting Flowcharts solution to document and communicate visually how accounting processes work, and how each operation is done.
 Healthcare Management Workflow Diagrams
Healthcare Management Workflow Diagrams solution contains large set of colorful samples and libraries with predesigned vector pictograms and symbols of health, healthcare equipment, medical instruments, pharmaceutical tools, transport, medication, departments of healthcare organizations, the medical icons of people and human anatomy, as well as the predesigned flowchart objects, connectors and arrows, which make it the best for designing clear and comprehensive Medi?al Workflow Diagrams and Block Diagrams, Healthcare Management Flowcharts and Infographics, Healthcare Workflow Diagram, for depicting the healthcare workflow and clinical workflows in healthcare, for making the workflow analysis healthcare and healthcare workflow management.
Why flowchart is important to accounting information system?

Pyramid Diagram

Stakeholder Management System

ConceptDraw DIAGRAM is a powerful diagramming and vector drawing software. Now, thanks to the Stakeholder Onion Diagrams Solution included to the Management Area of ConceptDraw Solution Park, ConceptDraw DIAGRAM became also unique stakeholder management system design software.
IDEF0 Visio

Pyramid Diagram

Pyramid Diagram

Fishbone Diagram Example

Fishbone Diagrams solution included to ConceptDraw Solution Park contains powerful drawing tools and a lot of examples, samples and templates. Each Fishbone diagram example is carefully thought-out by experts and is perfect source of inspiration for you.
Chart Audit

Chart Audit is incredibly convenient for representing important information about audit process and audit planning process. It also helps auditors to define the problem areas and to elaborate the ways of their solving and effectiveness improvement.
Accounting Data Flow from the Accounting Flowcharts Solution

Accounting Flowcharts Solution contains also a wide variety of templates and samples that you can use as the base for your own Accounting Flowcharts of any complexity.
 Plan-Do-Check-Act (PDCA)
Plan-Do-Check-Act (PDCA) solution extends the ConceptDraw DIAGRAM software with collection of samples and predesigned vector objects for easy visualization four stages of PDCA cycle, PDSA cycle, or Deming cycle, for illustration effective application of this method to the practical business tasks, for depiction the implementation of changes and solution the problems in business processes. Plan-Do-Check-Act (PDCA) solution helps to design professional-looking and attractive Plan Do Study Act diagrams, PDCA cycle diagrams, PDCA Process diagrams, and to construct the Quality Management Process Models, which all assist to manage efficiently the business processes, to improve quality of work and to reduce significantly the costs.
Data Flow Diagram Process

Accounting Flowchart: Purchasing, Receiving, Payable and Payment

- Management Information System
- With The Aid Of Diagram Explain Management Information System
- Management Information System Triangle Diagram
- Management Information Systems Business Process Flowchart
- 5 Level pyramid model diagram - Information systems types | 4 Level ...
- Management Information System With Example In Flow Chart
- Chart Of Management Information System With Diagram
- Pyramid Diagrams | Management Information Systems Pyramid Pdf
- Types Of Management Information System Block Diagram
- Management Control And Information Systems Flowchart
- 5 Level pyramid model diagram - Information systems types | Draw ...
- 4 Level pyramid model diagram - Information systems types | Types ...
- 5 Level pyramid model diagram - Information systems types ...
- How to Create Flowcharts for an Accounting Information System ...
- 4 Level pyramid model diagram - Information systems types | 5 Level ...
- Information Flow Chart Of Mis
- Flow Diagram Of Marketing Information System
- Management Information System Block Diagram
- Describe Health Information Systems Using Illustration Of Pyramid
- Church Management Information System Use Case Diagram
- ERD | Entity Relationship Diagrams, ERD Software for Mac and Win
- Flowchart | Basic Flowchart Symbols and Meaning
- Flowchart | Flowchart Design - Symbols, Shapes, Stencils and Icons
- Flowchart | Flow Chart Symbols
- Electrical | Electrical Drawing - Wiring and Circuits Schematics
- Flowchart | Common Flowchart Symbols
- Flowchart | Common Flowchart Symbols