A four level pyramid model of different types of Information Systems based on the different levels of hierarchy in an organization. The first level represents transaction processing systems for workers. The second level represents management information systems for middle managers. The third level represents decision support systems for senior menegers. The fourth level represents executive information systems for executives.
"The "classic" view of Information systems found in the textbooks in the 1980s was of a pyramid of systems that reflected the hierarchy of the organization, usually transaction processing systems at the bottom of the pyramid, followed by management information systems, decision support systems, and ending with executive information systems at the top. Although the pyramid model remains useful, since it was first formulated a number of new technologies have been developed and new categories of information systems have emerged, some of which no longer fit easily into the original pyramid model.
Some examples of such systems are:
data warehouses,
enterprise resource planning,
enterprise systems,
expert systems,
search engines,
geographic information system,
global information system,
office automation." [Information systems. Wikipedia]
This diagram was redesigned using the ConceptDraw PRO diagramming and vector drawing software from Wikimedia Commons file Four-Level-Pyramid-model.png. [commons.wikimedia.org/ wiki/ File:Four-Level-Pyramid-model.png]
This file is licensed under the Creative Commons Attribution-Share Alike 3.0 Unported license. [creativecommons.org/ licenses/ by-sa/ 3.0/ deed.en]
The triangle chart example "Information systems types" is included in the Pyramid Diagrams solution from the Marketing area of ConceptDraw Solution Park.
Pyramid diagram

A five level pyramid model of different types of Information Systems based on the information processing requirement of different levels in the organization. The first level represents transaction processing systems to process basic data. The second level represents office support systems to process information in office. The third level represents management information systems to process information by managers. The fourth level represents decision support systems to process explicit knowledge. The fifth level represents executive information systems to process tacit knowledge.
"A Computer(-Based) Information System is essentially an IS using computer technology to carry out some or all of its planned tasks. The basic components of computer based information system are:
(1) Hardware - these are the devices like the monitor, processor, printer and keyboard, all of which work together to accept, process, show data and information.
(2) Software - are the programs that allow the hardware to process the data.
(3) Databases - are the gathering of associated files or tables containing related data.
(4) Networks - are a connecting system that allows diverse computers to distribute resources.
(5) Procedures - are the commands for combining the components above to process information and produce the preferred output.
The first four components (hardware, software, database and network) make up what is known as the information technology platform. Information technology workers could then use these components to create information systems that watch over safety measures, risk and the management of data. These actions are known as information technology services." [Information systems. Wikipedia]
This pyramid diagram was redesigned using the ConceptDraw PRO diagramming and vector drawing software from Wikimedia Commons file Five-Level-Pyramid-model.png. [commons.wikimedia.org/ wiki/ File:Five-Level-Pyramid-model.png]
This file is licensed under the Creative Commons Attribution 3.0 Unported license. [creativecommons.org/ licenses/ by/ 3.0/ deed.en]
The triangle chart example "Information systems types" is included in the Pyramid Diagrams solution from the Marketing area of ConceptDraw Solution Park.
Pyramid diagram

Education Information

This financila dashboard example was drawn on the base of the Enterprise dashboard from the Mecklenburg County Government website.
[charmeck.org/ mecklenburg/ county/ CountyManagersOffice/ OMB/ dashboards/ Pages/ Enterprise.aspx]
"In management information systems, a dashboard is "an easy to read, often single page, real-time user interface, showing a graphical presentation of the current status (snapshot) and historical trends of an organization’s key performance indicators to enable instantaneous and informed decisions to be made at a glance."
For example, a manufacturing dashboard may show key performance indicators related to productivity such as number of parts manufactured, or number of failed quality inspections per hour. Similarly, a human resources dashboard may show KPIs related to staff recruitment, retention and composition, for example number of open positions, or average days or cost per recruitment.
Types of dashboards.
Dashboard of Sustainability screen shot illustrating example dashboard layout.
Digital dashboards may be laid out to track the flows inherent in the business processes that they monitor. Graphically, users may see the high-level processes and then drill down into low level data. This level of detail is often buried deep within the corporate enterprise and otherwise unavailable to the senior executives.
Three main types of digital dashboard dominate the market today: stand alone software applications, web-browser based applications, and desktop applications also known as desktop widgets. The last are driven by a widget engine.
Specialized dashboards may track all corporate functions. Examples include human resources, recruiting, sales, operations, security, information technology, project management, customer relationship management and many more departmental dashboards.
Digital dashboard projects involve business units as the driver and the information technology department as the enabler. The success of digital dashboard projects often depends on the metrics that were chosen for monitoring. Key performance indicators, balanced scorecards, and sales performance figures are some of the content appropriate on business dashboards." [Dashboard (management information systems). Wikipedia]
The example "Enterprise dashboard" was created using the ConceptDraw PRO diagramming and vector drawing software extended with the Composition Dashboard solution from the area "What is a Dashboard" of ConceptDraw Solution Park.
Financial dashboard

UML Sequence Diagram Example. SVG Vectored UML Diagrams Tools

The vector stencils library "Meter indicators" contains 29 Live Objects: speedometer gauge, dial, bullet graph, slider and level meter visual indicators.
The Live Objects designed to display actual measures of performance metrics and KPIs from external data source files.
Some of them also display comparative measures, and colored zones of qualitative ranges with legend.
Use it to draw business performance dashboards using the ConceptDraw PRO diagramming and vector drawing software .
"Digital dashboards may be laid out to track the flows inherent in the business processes that they monitor. Graphically, users may see the high-level processes and then drill down into low level data. This level of detail is often buried deep within the corporate enterprise and otherwise unavailable to the senior executives. ...
Specialized dashboards may track all corporate functions. Examples include human resources, recruiting, sales, operations, security, information technology, project management, customer relationship management and many more departmental dashboards. ...
Like a car's dashboard (or control panel), a software dashboard provides decision makers with the input necessary to "drive" the business. Thus, a graphical user interface may be designed to display summaries, graphics (e.g., bar charts, pie charts, bullet graphs, "sparklines," etc.), and gauges (with colors similar to traffic lights) in a portal-like framework to highlight important information. ...
Digital dashboards allow managers to monitor the contribution of the various departments in their organization. To gauge exactly how well an organization is performing overall, digital dashboards allow you to capture and report specific data points from each department within the organization, thus providing a "snapshot" of performance." [Dashboard (management information systems). Wikipedia]
The example "Design elements - Meter indicators" is included in the Meter Dashboard solution from the area "What is a Dashboard" of ConceptDraw Solution Park.
Visual indicators

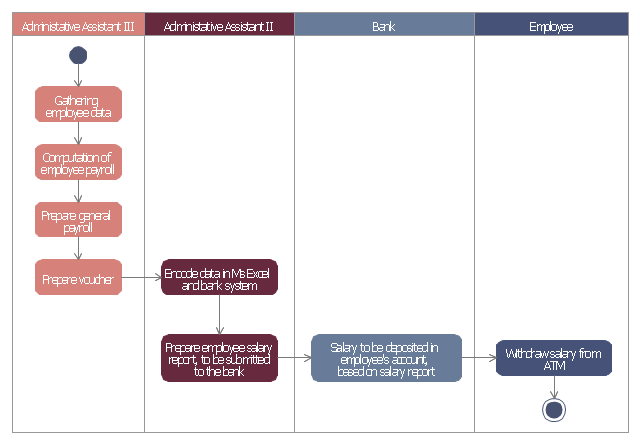
This example of automated payroll management system UML activity diagram was created on the base of figure on the webpage "Automated payroll management system" from ethelmandane.wikispaces.com.
"In the Philippines and in other foreign countries the government has a trend to embrace automation for process efficiency. One of the processes that are being automated is the payroll process. Payroll is the total amount required to pay workers and employees during a week, month or other period.
One of the government offices that desires to automate their payroll system is the NSO Camarines Sur which is located 2nd Floor MMCN Building, Panganiban Avenue, Naga City. The National Statistics Office (NSO) envisions to be recognized as a world-class provider of statistical and civil registration products and services and lives with its mission to produces and provides quality statistical and civil registration products and services. ...
The project seeks to create an Information System Plan for an Automated Payroll Management System. ...
The creation of the Information System Plan will benefit the accounting section of the organization. Specifically it is significant to:
1. Administrative Assistants. It will help to lessen time and effort in preparing and computing the salary of the employee.
2. NSO. It will help the organization to be more productive and efficient."
[ethelmandane.wikispaces.com/ ]
This file is licensed under a Creative Commons Attribution Share-Alike 3.0 License. [creativecommons.org/ licenses/ by-sa/ 3.0/ ]
This UML activity diagram example modeling the automated payroll management system using automated teller machine (ATM) was created using the ConceptDraw PRO diagramming and vector drawing software extended with the ATM UML Diagrams solution from the Software Development area of ConceptDraw Solution Park.
UML activity diagram of automated payroll management system using ATM
Pyramid Diagram

Pyramid Diagram

HR infographics "Electronic human resources (E-HR)" was redesigned from the Wikimedia Commons file: Ehr diagram.jpg. [commons.wikimedia.org/ wiki/ File:Ehr_ diagram.jpg]
This file is licensed under the Creative Commons Attribution-Share Alike 3.0 Unported license. [creativecommons.org/ licenses/ by-sa/ 3.0/ ]
"E-HR is a function of HR that is concerned with the use, management, and regulation of electronic information and processes within an organization.
E-HR is different from E-HRM (Electronic Human Resource Management) and HRIS (Human Resource Information System) which are uses of technology. More specifically, E-HRM is a system that allows management and employees access to human resource related information and services through an organization's intranet or web portal. HRIS refers to enterprise resource planning software that streamlines human resource functions such as payroll.
In contrast, E-HR is a function of human resources that requires cross-functional knowledge and collaboration between multiple departments, most notably human resources and information technology." [Electronic human resources. Wikipedia]
The HR infographics example "Electronic human resources (E-HR)" was created using the ConceptDraw PRO diagramming and vector drawing software extended with the HR Flowcharts solution from the Management area of ConceptDraw Solution Park.
HR infographics
.png--diagram-flowchart-example.png)
Used Solutions
Pyramid Diagram

Affinity Diagram

How to Create Flowcharts for anAccounting Information System

The vector stencils library "Sales department" contains 49 company department icons.
Use these sales pictograms to draw your sales flowcharts, workflow diagrams and process charts with the ConceptDraw PRO diagramming and vector drawing software.
The vector stencils library "Sales department" is included in the Sales Flowcharts solution from the Marketing area of ConceptDraw Solution Park.
Accounting

Accounts payable

Accounts receivable

Audit

Bank

Board of directors

Copy center

Customer service operator

Customer service technician

Data center

Delivery

Design

Devices management

Distribution

Distribution

Employee

Engineering

Facilities

Finance

Human resource

Devices management

Information systems

International division

International marketing

International sales

Inventory

Legal department

Mail room

Mail service

Management

Manufacturing

Marketing

Motorpool

Online service

Packaging

Payroll

Publications

Purchasing

Quality assurance

Receiving

Reception

Research and development

Sales growth

Scales

Security

Shipping

Suppliers

Telecommunication

Warehouse

Decision Making Software For Small Business


Design Pictorial Infographics. Design Infographics

Sales Process Flowchart Symbols

Export from ConceptDraw MINDMAP to PDF (Adobe Acrobat®) File
 File *")
 Healthcare Management Workflow Diagrams
Healthcare Management Workflow Diagrams solution contains large set of colorful samples and libraries with predesigned vector pictograms and symbols of health, healthcare equipment, medical instruments, pharmaceutical tools, transport, medication, departments of healthcare organizations, the medical icons of people and human anatomy, flowchart objects, connectors, and arrows, which make it the best for designing clear and comprehensive Medical Workflow Diagrams and Block Diagrams, Healthcare Management Flowcharts and Infographics, Healthcare Workflow Diagram, for depicting the healthcare workflow and clinical workflows in healthcare, for making the workflow analysis healthcare and healthcare workflow management.
How to Create a Scatter Chart

- 5 Level pyramid model diagram - Information systems types ...
- 5 Level pyramid model diagram - Information systems types | 4 Level ...
- 4 Level pyramid model diagram - Information systems types | With ...
- 5 Level pyramid model diagram - Information systems types | 4 Level ...
- 4 Level pyramid model diagram | Management Hierarchy Of Mis
- Enterprise dashboard | Project Management Information System
- Pyramid Diagrams | Management Information System Pyramid
- ConceptDraw Solution Park | SYSML | Marketing | Pyramidical ...
- Block Diagrams | IDEF3 Standard | IDEF0 Diagrams | Basic ...