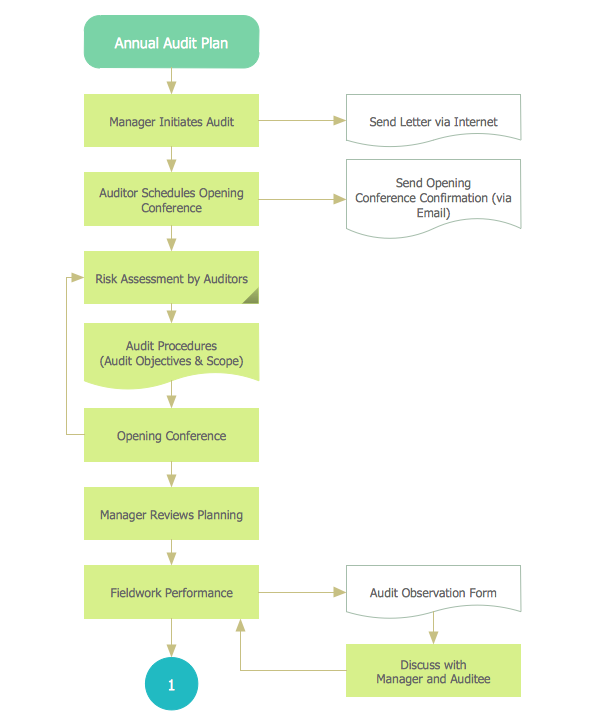
Example 1. Chart Audit
Chart Audit is incredibly convenient for representing important information about audit process and audit planning process. It also helps auditors to define the problem areas and to elaborate the ways of their solving and effectiveness improvement.

Example 2. Chart Audit - Claim Data Processing
Audit Flowcharts Solution provides extensive drawing tools, set of samples and library with predesigned vector shapes which help easy design detailed Chart Audit, to represent on it all steps of the auditing process, beginning from pre-audit preparation.

Example 3. Chart Audit - Project Management Process
The Chart Audit samples you see on this page were created in ConceptDraw DIAGRAM using the Audit Flowcharts Solution for ConceptDraw Solution Park. These diagrams successfully demonstrate solution's capabilities and professional results you can achieve. An experienced user spent 5-10 minutes creating every of these samples.
Use the Audit Flowcharts Solution for ConceptDraw DIAGRAM software to create your own professional looking Chart Audit of any complexity quick, easy and effective, and then successfully use it in your work activity.
All source documents are vector graphic documents. They are available for reviewing, modifying, or converting to a variety of formats (PDF file, MS PowerPoint, MS Visio, and many other graphic formats) from the ConceptDraw STORE. The Audit Flowcharts Solution is available for all ConceptDraw DIAGRAM or later users.
NINE RELATED HOW TO's:
Problem Solving - ConceptDraw OFFICT suite is a software for the problem solving. The Seven Management and Planning Tools solution is a set of such tools for investigating complex problems.
These tools are exemplary at organizing research, parsing complex problems, providing a structure for the details, helping managers make decisions, and organizing effective communications in a visual manner that keeps everyone involved.
Picture: Problem solving
On this diagram are used the flowchart symbols that represents the processes and documents.
Picture:
Credit Card Order Process Flowchart.
Flowchart Examples
Related Solution:
Diagramming is an astonishing way to visualize business processes. The list of the most common business process flowchart symbols is quite long starting from basic flowcharts, continuing with SIPOC diagrams. Business process modeling was never easier than now, with special ConceptDraw Business Process Mapping solution.
To carry out all professional standard requirements for business processes mapping, it is necessarily to follow the special graphical notations. ConceptDraw Business Process Mapping solution offers an exhaustive suite of tools to aid business process mapping. There are three vector libraries SIPOC Diagrams, Business Process Flowcharts, and Swim Lanes that contains totally more than 50 symbols of standard BPM notations. This is all that professionals need to effectively evaluate and manage quality in business processes.
Picture: Business Process Flowchart Symbols
Related Solution:
A flowchart is a simple but very functional tool when it comes to understanding a workflow or to removing unnecessary stages from a process. When drawing flowcharts, keep in mind that there are four common types of flowcharts, like document flowcharts and data flowcharts that show control over a data or document flow over a system. To show controls on a physical level, use system flowcharts. In addition, to show controls in a program, you can draw a program flowchart.
This flowchart diagram represents the piece of an article editing process, that involves the author and editor. It was created using the Basic Flowchart notation that consists from the basic flowchart symbols. The start and the end of the process are indicated with "Terminator" symbols. The "Process" symbols show the action steps consisting from making edits and searching for a compromise, when the author does not agree with the suggestions of the editor. The "Process" symbol is the general symbol in process flowcharts. The "Decision" symbol indicates a branching in the process flow. There are two branches indicated by a Decision shape in the current flowchart (Yes/No, Disagree/Agree). This basic flowchart can be used as a repeating unit in the workflow diagram describing the working process of some editorial office.
Picture: Types of Flowcharts
Related Solution:
ConceptDraw DIAGRAM is a Mac OS X and Windows platforms professional software to draw your own business process diagrams and flowcharts.
Picture: Professional Diagram and Flowchart Software
A requisition form is one of the documents used for accounting in different manufacturing processes. There are two main types of requisition: a purchasing requisition and material requisition and difference between them is significant. Creating a flowchart might help you in understanding all the details of accounting process.
Flowcharts are a best visual method for dividing a large and complicated procedure into a several little clear pieces. The main value-ability of an effective flowchart is its simpleness. Material requisition flowcharts are used to document the process of relationships between the different departments and the purchasing department within an organization. The flow chart gives the step-by-step guide on how is carried out the procurement process of the materials necessary for the functioning of the organization. This type of flowchart along with many other business flowcharts, one can easy create using ConceptDraw Flowcharts solution.
Picture: Material Requisition Flowchart. Flowchart Examples
Related Solution:
It is convenient to use a powerful ConceptDraw DIAGRAM software extended with Flowcharts Solution to design flowcharts of various types which will additionally illustrate a definition flowchart.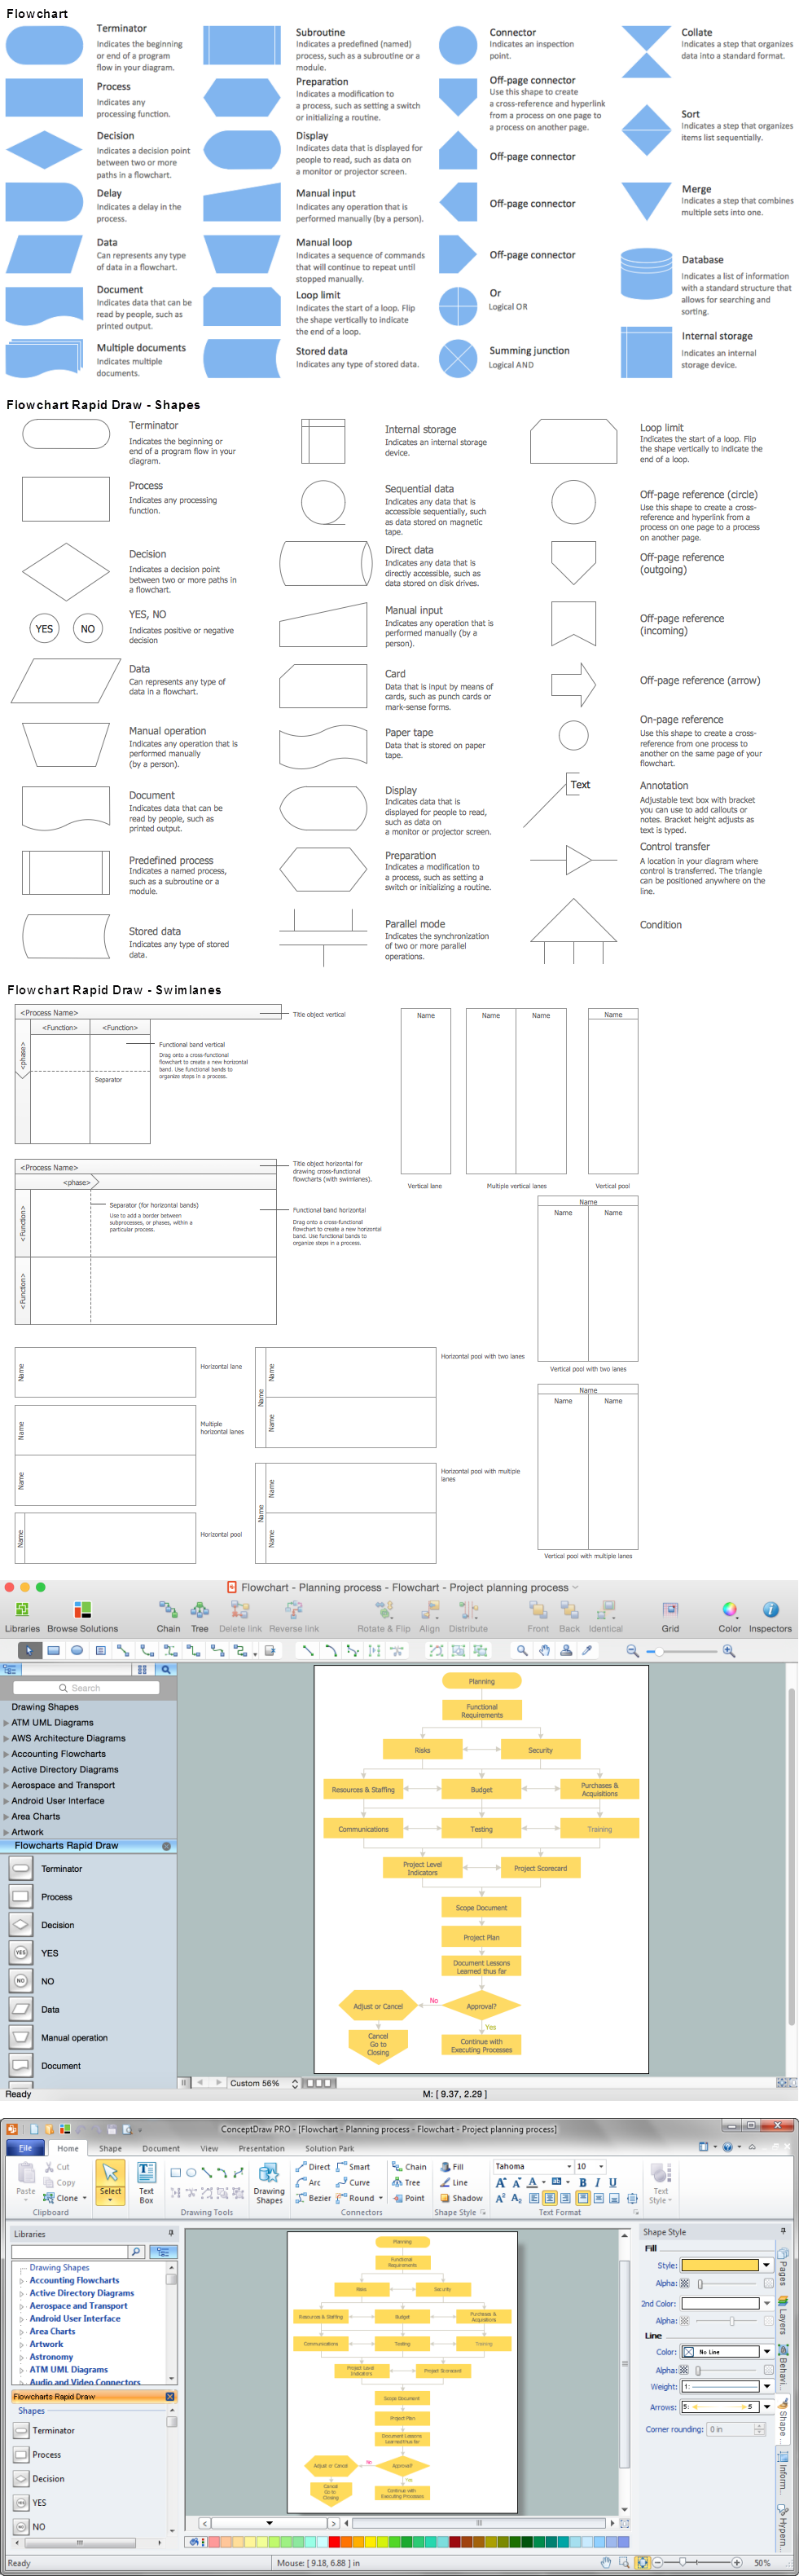
Picture: Definition Flowchart
Related Solution:
Fishbone diagrams work for most entrepreneurs and almost any industry or person having a problem. Professional diagramming software may help you create Fishbone (Cause and Effect or Ishikawa) diagrams. When people are unclear about what is causing an issue, ConceptDraw DIAGRAM will be your lifesaver.
When to use a Fishbone diagram? Originally developed as a quality control tool, you may find a Fishbone diagram helpful when used in many cases, such as to analyze a complex problem when there are many causes, for identifying all possible root causes for an effect or a problem, when you need different point of view to look on a problem, to uncover bottlenecks and identify where and why a process doesn't work, for acceleration a process when traditional ways of problem solving consume many time.
Picture: When To Use a Fishbone Diagram
Related Solution:
Flowcharts can be used in designing and documenting both simple and complex processes or programs and, similar to the other types of diagrams, they can help visualize what happens and so help understand some definite process, and, as a result, find flaws, bottlenecks and other features within it.
Picture: Flowchart Programming Project. Flowchart Examples
Related Solution:

