Pyramid Diagram

Pyramid Diagram

Pyramid Diagram

Pyramid Diagram

Pyramid Diagram

Pyramid Diagram and Pyramid Chart

Pyramid Diagram

Pyramid Chart Examples

HelpDesk
How to Draw a Pyramid Diagram

Pyramid Diagram

Energy Pyramid Diagram

Energy Pyramid Diagram begins from the producers (plants) and proceeds through a few trophic levels of consumers (herbivores which eat these plants, the carnivores which eat these herbivores, then carnivores which eat those carnivores, and so on) to the top of the food chain.
Pyramid Diagram

Pyramid Diagram

How to Create a Pyramid Diagram

 Pyramid Diagrams
Pyramid Diagrams solution extends ConceptDraw DIAGRAM software with templates, samples and library of vector stencils for drawing the marketing pyramid diagrams.
Pyramid Diagram

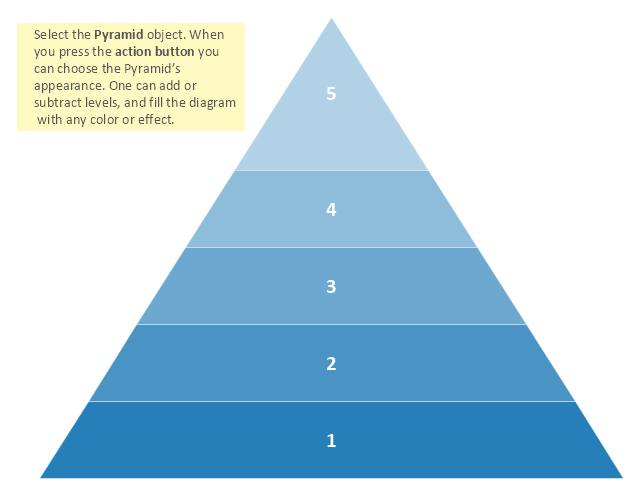
five level pyramid example is included in the Pyramid Diagrams solution from Marketing area of ConceptDraw Solution Park.
Pyramid visualize the relationship building blocks as a triangle divided into horizontal slices, and may be oriented up or down. Labelled slices represent a hierarchy.
Pyramids are used in marketing presentations to show and analyze hierarchy levels.
This triangular diagram template for the ConceptDraw PRO diagramming and vector drawing software is included in the Pyramid Diagrams solution from the Marketing area of ConceptDraw Solution Park.
Pyramids are used in marketing presentations to show and analyze hierarchy levels.
This triangular diagram template for the ConceptDraw PRO diagramming and vector drawing software is included in the Pyramid Diagrams solution from the Marketing area of ConceptDraw Solution Park.
Pyramid diagram template
Pyramid Diagram

A five level pyramid model of different types of Information Systems based on the information processing requirement of different levels in the organization. The first level represents transaction processing systems to process basic data. The second level represents office support systems to process information in office. The third level represents management information systems to process information by managers. The fourth level represents decision support systems to process explicit knowledge. The fifth level represents executive information systems to process tacit knowledge.
"A Computer(-Based) Information System is essentially an IS using computer technology to carry out some or all of its planned tasks. The basic components of computer based information system are:
(1) Hardware - these are the devices like the monitor, processor, printer and keyboard, all of which work together to accept, process, show data and information.
(2) Software - are the programs that allow the hardware to process the data.
(3) Databases - are the gathering of associated files or tables containing related data.
(4) Networks - are a connecting system that allows diverse computers to distribute resources.
(5) Procedures - are the commands for combining the components above to process information and produce the preferred output.
The first four components (hardware, software, database and network) make up what is known as the information technology platform. Information technology workers could then use these components to create information systems that watch over safety measures, risk and the management of data. These actions are known as information technology services." [Information systems. Wikipedia]
This pyramid diagram was redesigned using the ConceptDraw PRO diagramming and vector drawing software from Wikimedia Commons file Five-Level-Pyramid-model.png. [commons.wikimedia.org/ wiki/ File:Five-Level-Pyramid-model.png]
This file is licensed under the Creative Commons Attribution 3.0 Unported license. [creativecommons.org/ licenses/ by/ 3.0/ deed.en]
The triangle chart example "Information systems types" is included in the Pyramid Diagrams solution from the Marketing area of ConceptDraw Solution Park.
Pyramid diagram

Pyramid Diagram

3D triangular diagram of DIKW pyramid has 6 levels: measurement, facts, data, information, knowledge, wisdom.
The data component include different scattered signs or symbols which are merely useless until these random objective facts are somehow processed. Data is a resource which has to be manipulated or rearranged to get useful. Information can be extracted from a pile of data, it also can be mined from different data storages.
- Pyramid Diagram | 4 Level pyramid model diagram - Information ...
- 4 Level pyramid model diagram - Information systems types ...
- Pyramid Diagram
- Pyramid diagram - Template | Pyramid Diagram and Pyramid Chart ...
- Pyramid Diagram | Process Flowchart | Pyramid Diagram | Chart Of ...
- Pyramid Diagram | 5 Level pyramid model diagram - Information ...
- 3D Segmented pyramid chart - Template | Segmented pyramid ...
- 6-Level 3D pyramid diagram - Template | Pyramid diagrams - Vector ...
- 3D Triangle diagram - Template | 3D Segmented pyramid chart ...
- Market value - Pyramid diagram | Pyramid Diagrams | Pyramid ...
- Social strategy - Pyramid diagram | Social Media Marketing ...
- 4 Level pyramid model diagram - Information systems types | With ...
- Pyramid Diagram | 3D Triangle diagram - Template | 3D Segmented ...
- Pyramid Diagram and Pyramid Chart
- Triangular Venn diagram - Template | Pyramid diagrams - Vector ...
- Compound Pyramid Diagram
- Pyramid Diagram and Pyramid Chart | Circle Spoke Diagram ...
- 4 Level pyramid model diagram - Information systems types | Office ...
- Energy Pyramid Diagram | Pyramid Chart Maker | Pyramid Charts ...
- Social strategy - Pyramid diagram | Ice Hockey Diagram ...
- ERD | Entity Relationship Diagrams, ERD Software for Mac and Win
- Flowchart | Basic Flowchart Symbols and Meaning
- Flowchart | Flowchart Design - Symbols, Shapes, Stencils and Icons
- Flowchart | Flow Chart Symbols
- Electrical | Electrical Drawing - Wiring and Circuits Schematics
- Flowchart | Common Flowchart Symbols
- Flowchart | Common Flowchart Symbols