This site uses cookies. By continuing to browse the ConceptDraw site you are agreeing to our Use of Site Cookies.
HelpDesk

How to Track Your Project Plan vs. the Actual Project Condition

Conceptdraw PROJECT allows to follow how the project is going. You can easily compare the actual project data with the planned ones. The best tool for effective tracking of the project execution is to compoare real data with project baseline. It consists from the baseline start, baseline finish and baseline cost. Along with Baseline tracking ConceptDraw PROJECT offers several types of visual reports that can help to assess visually the difference between planned and actual project data.

Project Management, Dashboards, project, project indicators, KPI, solution park PM Dashboards

Project Management, Dashboards, project, project indicators, KPI, solution park
This solution extends ConceptDraw PRO and ConceptDraw PROJECT software with the ability to clearly display the identified key performance indicators for any project.
HelpDesk

How to Identify Project Milestones

Tips on how to set milestones in a project file
HelpDesk

How to Use ConceptDraw Sales Dashboard Solution
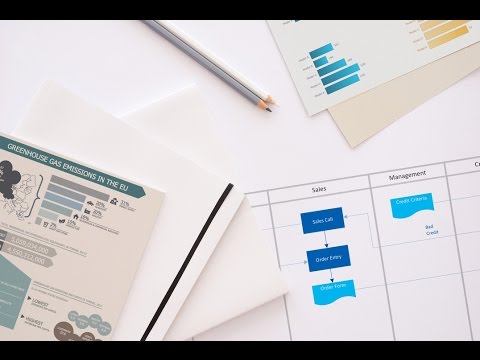
The interactive visual dashboard is a valuable tool for any sales team. Sales dashboard allows you to view and monitor sales indicators that are important for manager and sales staff . It helps to use the timely and reliable information to improve the quality of sales performance and increase sales revenues. ConceptDraw Sales Dashboard solution is a tool for both: sales manager and sales team. It provides the visualization of key performance indicators that are critical to the entire sales organization. The custom sales dashboard displays the real-time information on sales performance KPIs with the help of intuitive and easy-to-understand diagrams and charts. Sales Dashboard helps the entire team see where they are, and what needs to be done. With ConceptDraw PRO you can easily create a visual Sales Dashboard using Live Objects Technology.
ConceptDraw Live Visual Dashboards

The Facts and KPIs

Visualizing sales data help you see the facts and KPIs about your sales process to make conclusions and see how your business can improve.
HelpDesk

How to Set a Project Baseline Using ConceptDraw PROJECT

Project baseline in ConceptDraw PROJECT is excellent forguiding the execution of the current project and can be useful for further projects.

A KPI Dashboard Provides the Answers Your Sales Team

Sales dashboard is a tool that provides the answers to all questions your sales team may have. A mature sales dashboard provides complete set of KPI to shows corporate, team or personal performance to keep sales process clear.

KPI Dashboard

ConceptDraw PRO diagramming and vector drawing software supplied with Sales Dashboard solution from the Marketing area of ConceptDraw Solution Park provides the full set of useful tools which make it the best for producing the live KPI Dashboard of any complexity.

Sales Dashboard Solutions can help your sales team keep an eye on performance

ConceptDraw Sales Dashboard Solution is a simple and effective way of visualizing sales data and get clear picture of your sales process to see how your business can improve.
HelpDesk

How to Manage Multiple Projects on Windows

ConceptDraw PROJECT lets you to track multiple projects at the same time.
HelpDesk

How to Create a Mind Map from Selected Tasks in Project

You can see the project data in a mind map structure by create a mind map from the selected project tasks.
How To Plan and Implement Projects with ConceptDraw Office

What is a KPI?

What is a KPI? Key performance indicators (KPIs) represent a set of measures that are focused on the aspects of organizational performance which are the most important for its current and future success.
ConceptDraw PRO diagramming and vector drawing software enhanced with Sales Dashboard solution from the Marketing area of ConceptDraw Solution Park allows effectively develop, analyze and improve your business thanks to the excellent possibility of monitoring all KPIs on one screen in a real time.
HelpDesk

How to Create Project Diagrams on Mac

Diagrams are very useful for project implementation because they help teams visualize important details such as interrelations between tasks, critical paths, timelines, milestones, calendars, and also resource usage.
HelpDesk

How to Create Multple Projects Schedule on Windows

ConceptDraw PROJECT is simple project scheduling software, it allows grouping individual projects into a multiple project that can use a common resource pool and a synchronized task schedule. You can create a detailed schedule of your multiple project quickly and easy with ConceptDraw PROJECT. When considering project change requests, project manager can model their interaction by grouping or dividing into sub-projects. It include useful critical path scheduling software tools. Multiproject Dashboard enables planning and managing several projects simultaneously using the single resource pool for all projects. The Multiproject Dashboard helps you plan multiple projects while providing you with overall view.
HelpDesk

How to Use the Effort-Driven Scheduling Method

The idea of Effort-driven scheduling in project management is that each project task can be scheduled and assumed basing to the amount of the available work hours. Effort-driven scheduling is used as the default method of project scheduling in ConceptDraw PROJECT. This means that task duration, units, and work amount for individual assignment depends on the entire work, required for a given task. Whether you add or remove resources, the total work amount still the same, while ConceptDraw PROJECT regulates the duration of task or units assigned for the given resources.