This site uses cookies. By continuing to browse the ConceptDraw site you are agreeing to our Use of Site Cookies.

Pie Chart Software

A pie chart is a circular diagram showing a set of data divided into proportional slices. There are several variations of this chart such as donut chart, exploded pie chart, multi-level pie charts. Although it is not very informative when a ring chart or circle chart has many sections, so choosing a low number of data points is quite important for a useful pie chart.
ConceptDraw DIAGRAM software with Pie Charts solution helps to create pie and donut charts for effective displaying proportions in statistics, business and mass media for composition comparison, i.e. for visualization of part percentage inside one total.
HelpDesk

How to Draw a Pie Chart

A pie chart represents data, in a clear and easy to read around (pie) form. A circular pie chart is divided into sections (slice). Each "slice" depicts the It reflects the proportion of each component in the whole "pie". This type of chart is most often used for the visualization of statistical data. That is why pie charts are widely used in marketing. As the pie charts show proportional parts of a whole, they are good for various visual comparisons. For example, it is difficult to imagine a more intuitive way to show segmentation and market share. ConceptDraw DIAGRAM allows you to draw a simple and clear Pie Chart using the Pie Charts solution.
HelpDesk

How to Draw the Different Types of Pie Charts

Using a Pie Chart, you can visually estimate the relative contribution that different data categories contribute to a whole value. The pie chart displays the statistics in a visual format. The main use of pie charts to show comparisons. The larger piece of the pie, the more the value of this value compared to the rest. Various applications of pie charts can be found in business and education. For business, pie charts can be used to compare the success or failure of the goods or services. They may also be used to display the business market share.

draw pie chart, draw donut chart Pie Charts

draw pie chart, draw donut chart
Pie Charts are extensively used in statistics and business for explaining data and work results, in mass media for comparison (i.e. to visualize the percentage for the parts of one total), and in many other fields. The Pie Charts solution for ConceptDraw DIAGRAM offers powerful drawing tools, varied templates, samples, and a library of vector stencils for simple construction and design of Pie Charts, Donut Chart, and Pie Graph Worksheets.

Bar Chart Software

The best bar chart software ever is ConceptDraw. ConceptDraw bar chart software provides an interactive bar charting tool and complete set of predesigned bar chart objects.

ConceptDraw Solution Park ConceptDraw Solution Park

ConceptDraw Solution Park
ConceptDraw Solution Park collects graphic extensions, examples and learning materials

Create Graphs and Charts

Charting Software allows you to create diagrams, charts, graphs, flowcharts, and other business graphics. ConceptDraw DIAGRAM include simple shape drawing tools, examples, templates, and symbol libraries.

Pie Chart

ConceptDraw DIAGRAM diagramming and vector drawing software offers the Pie Charts solution from the Graphs and Charts area of ConceptDraw Solution Park for quick and easy drawing the Pie Chart of any complexity.
HelpDesk

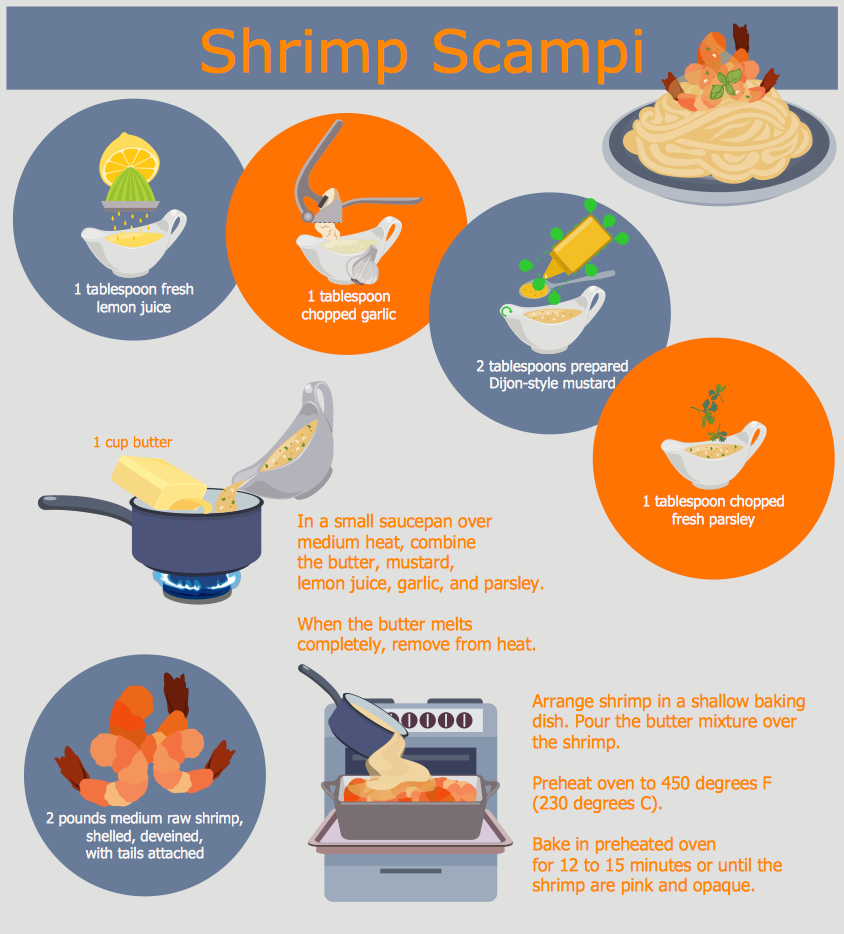
How to Design a Food-related Infographics

Today a large piece of business is referred to food. This business cannot be imagined without various kinds of visualizations. You can see them everywhere — on brand logos, in advertising, on menus, and in flyers. Also, different food-related infographics are used to promote healthy nutrition and to deliver information on how to maintain an effective diet. ConceptDraw Cooking Recipes solution offers a great collection of bright food-related images and icons, placed into themed libraries. It can be used for catering menu graphics, on marketing flyers, or as a concomitant text for infographics.

Column Chart Software

ConceptDraw Column Chart software allows drawing column charts using predesigned objects or drawing tools. In ConceptDraw Column Chart software you can find a complete set of column chart tools and objects.

How to Create a Pie Chart

Create a Pie Chart with ConceptDraw software quickly and easily. The simple tutorial helps you learn how to create a pie chart.
HelpDesk

How to Create a Timeline Diagram

A Timeline is a chart which displays a project plan schedule in chronological order. A Timeline is used in project management to depict project milestones and visualize project phases and show project progress. The graphic form of a timeline makes it easy to understand critical project milestones, such as the progress of a project schedule. Timelines are particularly useful for project scheduling or project management when accompanied with a Gantt chart. It captures the main of what the project will accomplish and how it will be done. making a project timeline is one of the most important skills a project manager needs have. Making comprehensive, accurate timelines allows you getting every project off in the best way. ConceptDraw DIAGRAM allows you to draw a timeline chart using a special library.

chemical engineering, process engineering, process flow diagram symbols, process and instrumentation diagram, process diagrams Chemical and Process Engineering

chemical engineering, process engineering, process flow diagram symbols, process and instrumentation diagram, process diagrams
This chemical engineering solution extends ConceptDraw DIAGRAM.9.5 (or later) with process flow diagram symbols, samples, process diagrams templates and libraries of design elements for creating process and instrumentation diagrams, block flow diagrams (BFD

Examples of Flowcharts, Org Charts and More

ConceptDraw examples covers a broad spectrum of business graphics categories. We separated all the graphic documents on application areas and had produced multiple solutions for each of them. ConceptDraw provides a wide variety of examples such as flowcharts, organizational charts, business charts, UML diagrams, database and ERD, directional map, network diagrams and lots more. Each solution accommodates 10+ examples that shows specific application cases of a diagram. ConceptDraw STORE is an application for downloading solutions with examples, templates and stencil libraries. Please choose any examples you are interested in, alternatively download them for free; you will need to install ConceptDraw to view them. As you will see, ConceptDraw is very powerful, you can use more than 10000 symbols, examples, and many pre-drawn templates, to create your own spectacular flowcharts, business diagrams, network diagrams and lots more, effortlessly, and in no time at all.
What is ConceptDraw OFFICE

Scatter Chart Examples

The Line Graphs solution from Graphs and Charts area of ConceptDraw Solution Park contains a set of examples, templates and design elements library of scatter charts.
Use it to draw scatter graphs using ConceptDraw DIAGRAM diagramming and vector drawing software for illustrating your documents, presentations and websites.