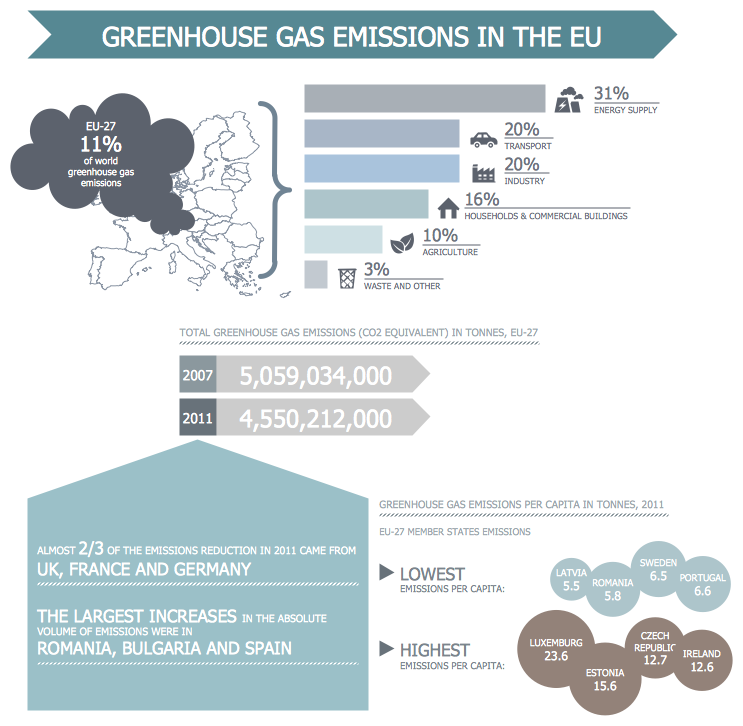
Pie Chart
No matter how complex your data is, it is always important to represent it in a much better way than text – in a way of a chart, such as a pie chart. Using the mentioned representation of the given data is a very good way of illustrating whatever needs to be shown as it becomes much more obvious and simple to understand seeing the information structured in a way of such drawing.
The pie chart is one of the most widely used types of chart having its sectors representing different elements of information in the different proportions, placed in different angles. The mentioned type of chart is very useful for illustrating any needed kind of data, which can be divided into the groups, different categories. The way this data can be represented with the help of ConceptDraw DIAGRAM diagramming and drawing software is very convenient. It becomes obvious to tell whether one sector looks smaller than another in a way of only looking at the freshly created pie chart and so on its sectors.
To be short, pie charts look like disks, each divided by different sectors illustrating different groups of data. Each of the sectors is known to be displaying its own numerical proportion, situated by an angle, simply proportional to the total quantity — 100%. The name of this type of chart comes from its resemblance to a sliced pie. Using pie chart you can always effectively display any needed proportions of its constituents within a very short period of time as long as you use ConceptDraw DIAGRAM diagramming and drawing software.
Allowing all the ConceptDraw DIAGRAM users to emphasize the value of each part of the whole amount of data illustrated on this chart, pie charts are one of the most commonly used types of diagrams, which drawing can be completed within only a couple of minutes in case you have the Pie Charts solution downloaded to your computer from another product of CS Odessa — ConceptDraw STORE application.

Example 1. Pie Chart Solution in ConceptDraw STORE
Having the mentioned solution means having all the necessary tools for making any type of the pie chart: those with its sectors located at a short distance from each other or those having them joined, those a hole in the centre of it (donut chart), etc. You can also always use any colour (better bright one) from the colour palette for completing the creation of your pie chart, so there will be more chances for other people to recognize which of the sectors describes what and so to easily tell if one of them is bigger than another.
If you add some legend to your chart, then it will increase your chances for having your pie chart more effective, leading to what you plan to achieve. Thus, having your chart coloured as well as having a legend can increase the understanding of your data illustrated in a way of a pie chart. Working in any type of the business activity as well as in statistics, you will find the pie chart to be very convenient as representing information in a way of a circle divided by its part is much more convenient rather than making a list of the items mentioning the percentage of each of them in a way of a text.
Pie charts are also very often used in mass media for comparing the given facts as well as other information, described in the main articles on the news sites, for example. The mentioned kind of chart is simply very widely used for visualizing the percentage of some unit’s parts, being very widely used in many different fields of the business activity. It can be always created with the aid of ConceptDraw DIAGRAM drawing and diagramming software, as it is a very useful tool for making similar drawings. Having the needed solution, such as a Pie Charts one, can be very useful as it can simplify your work of creating the mentioned charts by using the pre-made templates which can be simply edited in order to get the result you are aiming for.
Having both ConceptDraw DIAGRAM and Pie Chart solution can help you draw any needed Donut Chart Template, Exploded Pie Chart, Percentage Pie Chart, Donut Chart, Pie Chart, Arrow Ring Chart, as many other charts coloured in many different colours. You can always Free Download Pie Chart Software and View All Examples from this site to enjoy using the professional tool for making the described drawings.

Example 2. Pie Chart — Sector Weightings
Once you finish drawing your own chart, based on any of the previously made samples, you will get truly unique and professionally looking pie chart looking very smart as if you spent lots of hours creating it. Thus, having the appropriate solution, such as a Pie Charts one, eliminates your need of making whatever is needed from a scratch, meaning that you can save lots of time by using what was already previously created by professional charts makers. You can simply change the existing example by putting your data, converting it to your own incredibly great looking result.

Example 3. Pie Charts Library - Design Elements
Pie Charts library offers you 12 pie charts objects for any taste and of any color scheme. Simply drag the favorite of them from the library to your document, assign the data on the sectors and type the names of categories. The Pie Chart will be constructed according to your data.
Thus, in case you decide to make something very special looking very smart, as well as professional, then you can, first of all, download the ConceptDraw DIAGRAM diagramming and drawing software as well as the ConceptDraw STORE application from this site, then download the needed solution, such as a Pie Chart one in case you want to create a pie chart, then to choose any needed example out of so many different ones, converting it into your own drawing to end up having the result you always expected to get.

Example 4. Pie Chart — Business Report
Once you try to use the described sophisticated as well as very convenient in use software, you will get used to making any needed drawings very soon having the CS Odessa support team working for helping you to solve your issues and so to satisfy your needs. Enable yourself to make a great looking pie chart, as well as any other chart, flowchart, diagram, map, scheme or table, using any of the pre-made solutions, and so the stencil libraries and samples available for all the ConceptDraw DIAGRAM users. Download ConceptDraw DIAGRAM today to have a useful and helpful drawing application and so to recommend it to some other people you know and you care for.


A management consultant is an important person for the company, he helps in the questions of improving business performance and increasing profits, he consults for the questions of business strategy, management and financial controls, resources, and also suggests recommendations for changing the structure of the company if needed.
So, every day management consultant conduct the complex work and often use the helpful management infographics for explain his thoughts and arguments to the company direction. Thanks to the development of computer technologies, drawing of management infographics is so easy today. ConceptDraw DIAGRAM diagramming and vector drawing software offers you the Management Infographics Solution from the Business Infographics Area.