Gantt chart examples

Business diagrams & Org Charts with ConceptDraw DIAGRAM


Gantt Chart Software

ConceptDraw PROJECT Project Management Software Tool

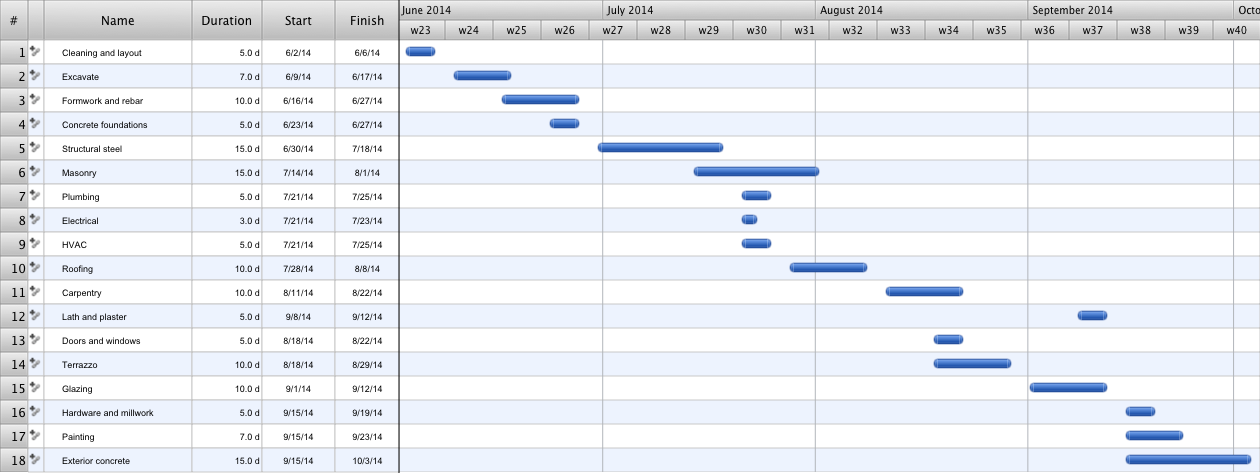
Construction Project Chart Examples
Project — Assigning Resources


Software Diagrams

HelpDesk
How to Add Several Hyperlinks to a Single Project Task

Business Diagram Software


HelpDesk
How to Share Mind Maps via Internet

In searching of alternative to MS Visio for MAC and PC with ConceptDraw DIAGRAM

 PM Presentations
The PM Presentations solution extends the power of ConceptDraw MINDMAP , ConceptDraw DIAGRAM , and ConceptDraw PROJECT, improving their efficiency at many stages of the project management process by using the same source data to construct the targeted presentation for your audience and clearly communicating the appropriate information to different audiences from a single source. It gives an ability to project managers and other team participants to create and to deliver capacious presentations representing the data and knowledge of a specific project with the help of including visual dashboards, Gantt charts, resource views, maps, timelines, calendars, illustrations, project diagrams and reports of varied types. Having the possibility to edit collaboratively in a Full-Screen Mode, the teams can rapidly plan a project as well as execute the tasks of revising and making changes to it.
 PM Planning
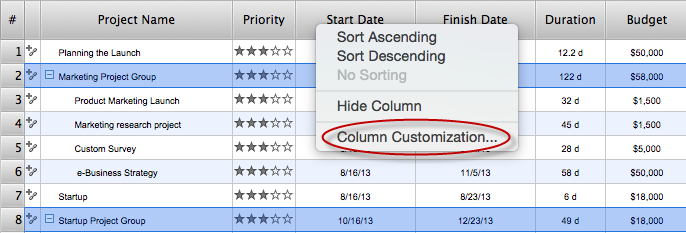
The PM Planning solution extends the functional abilities of ConceptDraw MINDMAP and ConceptDraw PROJECT software, allowing to automatically create the spreadsheets reflecting the tasks and project statuses for people who have different project roles. The reporting capabilities of this solution are represented by the possibility to generate a wide range of project reports that allow the project managers, senior management and other project participants to be informed on a project daily progress and monthly objectives: All Inclusive Report, All Visible Columns, Milestones with Notes and Objectives, Projects Goals, Projects Managers, Project Team, and Top Level Tasks. The PM Planning solution from ConceptDraw Solution Park is a strong project management and productivity tool which simplifies the process of reporting and lets one create a document with the desired report, includes the predesigned examples, extends and improves the planning capabilities for all team members, improves the project communication, helps to accurately plan, maintain, and finish projects on time, to track the work of project resources, to perform the analytical work and to make effective decisions.
HelpDesk
How to Create Project Diagrams on PC

HelpDesk
What Information can be Displayed in the Multiproject Dashboard View
HelpDesk
How to Support Your Mind Map with Visual Elements

HelpDesk
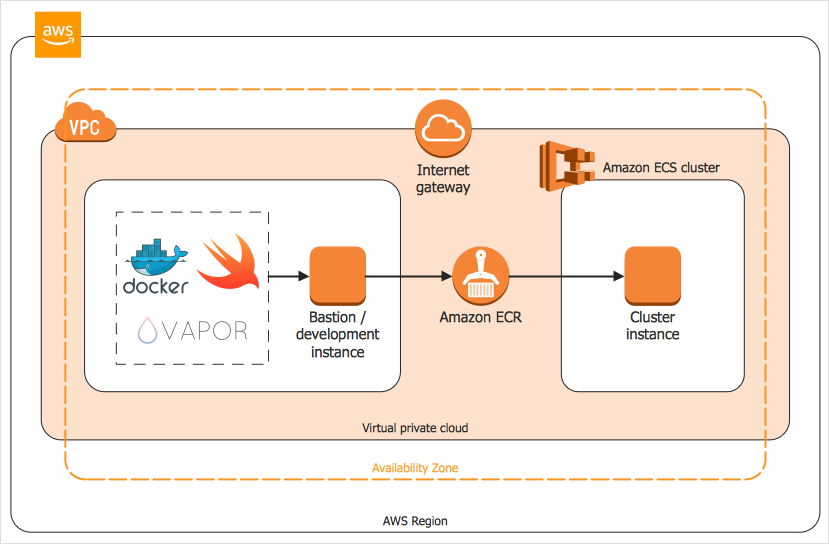
How to Create an AWS Architecture Diagram
Business Process Modeling Notation

- Gantt charts for planning and scheduling projects | Gant Chart in ...
- Construction Project Chart Examples | Gantt chart examples ...
- Gantt charts for planning and scheduling projects | Gant Chart in ...
- Construction Project Chart Examples | Gantt chart examples ...
- How To Implement Collaborative Project Management ...
- Status Dashboard | PM Dashboards | Project tasks dashboard ...
- Gantt charts for planning and scheduling projects | Examples of ...
- How to Create Gantt Chart
- How To Plan and Implement Projects Faster | Timeline diagram ...
- How To Implement Collaborative Project Management ...
- How to Export Project Data to MS Excel Worksheet | How To Create ...
- Communication Tool for Remote Project Management | One formula ...
- PM Easy | How to Report Task's Execution with Gantt Chart | Garrett ...
- Gant Chart in Project Management | Gantt charts for planning and ...
- How to Publish Project Reports on the Web Using ConceptDraw ...
- Diagramming software for Amazon Web Service icon set ...
- Communication Tool for Remote Project Management
- Project —Task Trees and Dependencies | Project management ...
- How To Implement Collaborative Project Management | How To ...
- Gantt chart examples | How To Plan and Implement Projects Faster ...