Simple Drawing Applications for Mac

ConceptDraw DIAGRAM : Able to Leap Tall Buildings in a Single Bound

Venn Diagram Examples for Problem Solving. Environmental Social Science. Human Sustainability Confluence

Fishbone Software Tools for Design Element
_Win_Mac.png)
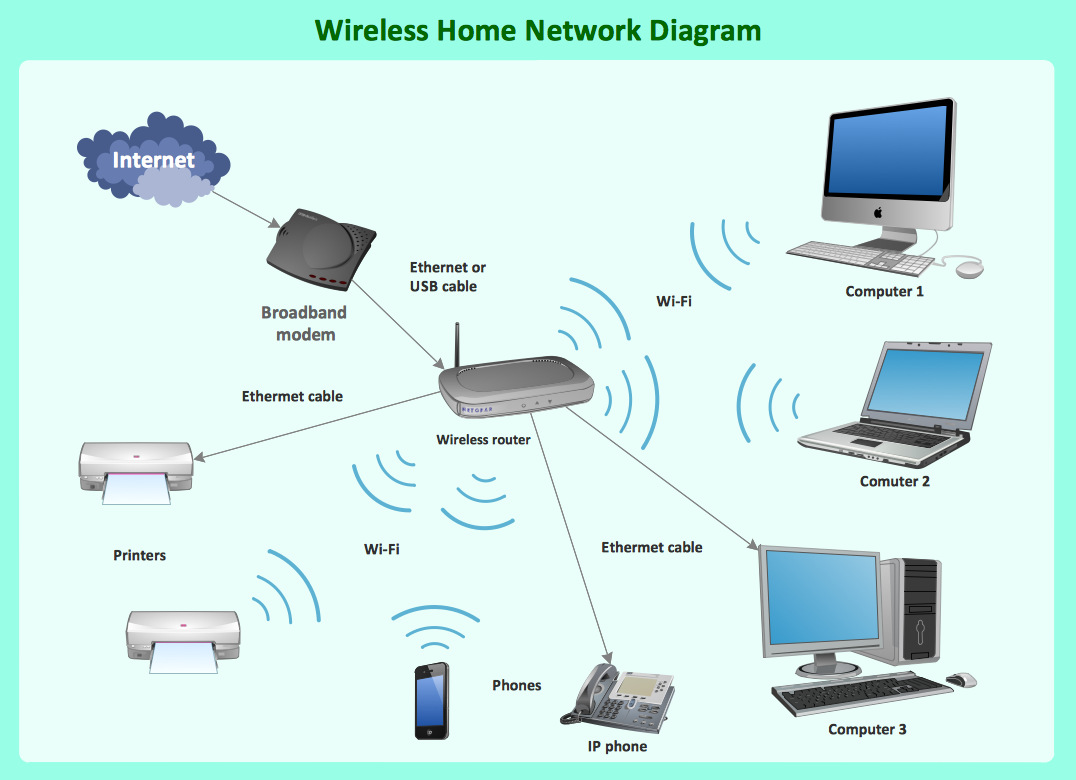
What Is a Wireless Network?
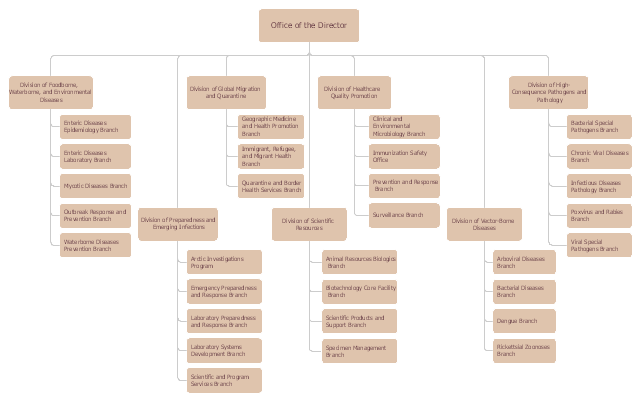
This example is based on the organizational chart from the NCEZID website. [cdc.gov/ ncezid/ org-ncezid.html]
"The National Center for Emerging and Zoonotic Infectious Diseases aims to prevent disease, disability, and death caused by a wide range of infectious diseases. We focus on diseases that have been around for many years, emerging diseases (those that are new or just recently identified), and zoonotic diseases (those spread from animals to people). Our work is guided in part by a holistic "One Health" strategy, which recognizes the vital interconnectedness of microbes and the environment. Through a comprehensive approach involving many scientific disciplines, we can attain better health for humans and animals and improve our environment.
To carry out our mission, we use many different tactics: providing leadership in public health, conducting exemplary science, strengthening preparedness efforts, establishing public health policy, sharing vital health information with the public, and building partnerships. Each of the center’s seven divisions works with partners to protect and improve the public’s health in the United States and worldwide." [cdc.gov/ ncezid/ ]
The organizational chart example "National Center for Emerging and Zoonotic Infectious Diseases" was created using the ConceptDraw PRO diagramming and vector drawing software extended with the Organizational Charts solution from the Management area of ConceptDraw Solution Park.
Organizational chart - National Center for Emerging and Zoonotic Infectious Diseases
Cisco Network Templates


 Target and Circular Diagrams
This solution extends ConceptDraw DIAGRAM software with samples, templates and library of design elements for drawing the Target and Circular Diagrams.
Bar Diagrams for Problem Solving. Create business management bar charts with Bar Graphs Solution

Bar Diagrams for Problem Solving. Create manufacturing and economics bar charts with Bar Graphs Solution

This example is based on the organizational chart from the Ohio State University website. [osu.edu/ vpsearch/ images/ University_ Org_ Chart.png]
"The Ohio State University, a multi-campus land grant institution with an international presence, is a world-class public research university and the leading comprehensive teaching and research institution in the state, Ohio's flagship university. Ohio State provides a distinctive educational experience for students and pursues cutting-edge interdisciplinary research that brings together scholars from diverse disciplines to solve key problems in society.
One of the University's core values is to "ignite a lifelong love of learning" in students. Ohio State students benefit from a scholarly environment in which research inspires and informs teaching.
The Vice President for Student Life provides vision, leadership, and strategic direction to the Office of Student Life, a comprehensive unit dedicated to supporting the educational mission of the University and promoting the best possible overall experience for the diverse student body of approximately 60,000. The Office of Student Life supports every aspect of Ohio State students experience. Its scope includes housing, campus dining, disability services, the multicultural center, counseling and health services, student organizations and leadership development, and other related operations." [osu.edu/ vpsearch/ ]
The organizational chart example "University leadership" was created using the ConceptDraw PRO diagramming and vector drawing software extended with the Organizational Charts solution from the Management area of ConceptDraw Solution Park.
Organizational chart - University leadership

What is SWOT Analysis?

SWOT Analysis

SWOT Analysis Software

Product Overview

Cause and Effect Diagram Software

Create Fishbone Diagrams with the ConceptDraw

- The Best Drawing Program for Mac | Scatter Chart Examples | Line ...
- The Best Flowchart Software Available | The Best Drawing Program ...
- Matrices | Feature comparison chart - Digital scouting cameras ...
- Venn Diagram Examples for Problem Solving. Environmental Social ...
- The Best Drawing Program for Mac | Chart Examples | Best Multi ...
- Business diagrams & Org Charts with ConceptDraw PRO | Flowchart ...
- Basic Diagramming | Drawing a Nature Scene | Beauty in nature ...
- The Best Drawing Program for Mac | Best Multi-Platform Diagram ...
- Program to Make Flow Chart | Good Flow Chart app for Mac ...
- Deployment chart template | SWOT Analysis Solution - Strategy ...
- Org chart - University | ConceptDraw PRO - Organizational chart ...
- Best Multi-Platform Diagram Software | The Best Drawing Program ...
- Drawing a Nature Scene | Drawing Illustration | Water Cycle |
- How to Draw an Organization Chart | ConceptDraw PRO ...
- Best Multi-Platform Diagram Software | The Best Drawing Program ...
- Venn Diagram Examples for Problem Solving. Computer Science
- Nature | How to Draw a Natural Landscape | Beautiful Nature Scene ...
- Marketing | What is SWOT Analysis? | Swot Analysis Strengths ...
- Process Flowchart | Business diagrams & Org Charts with ...
- Basic Diagramming | Flowchart Example: Flow Chart of Marketing ...