This site uses cookies. By continuing to browse the ConceptDraw site you are agreeing to our Use of Site Cookies.

Network Visualization with ConceptDraw DIAGRAM

ConceptDraw makes the entire process of network visualization easier thanks to the numerous ready-to-use objects included in the package for presentation of network equipment, LDAP directory symbols and many other objects that symbolize resources in most various representations.

Network Drawing Software

ConceptDraw Network Drawing Software - Network design software for network drawings with abundant examples and templates.
Create computer network designs, diagrams and schematics using ConceptDraw.

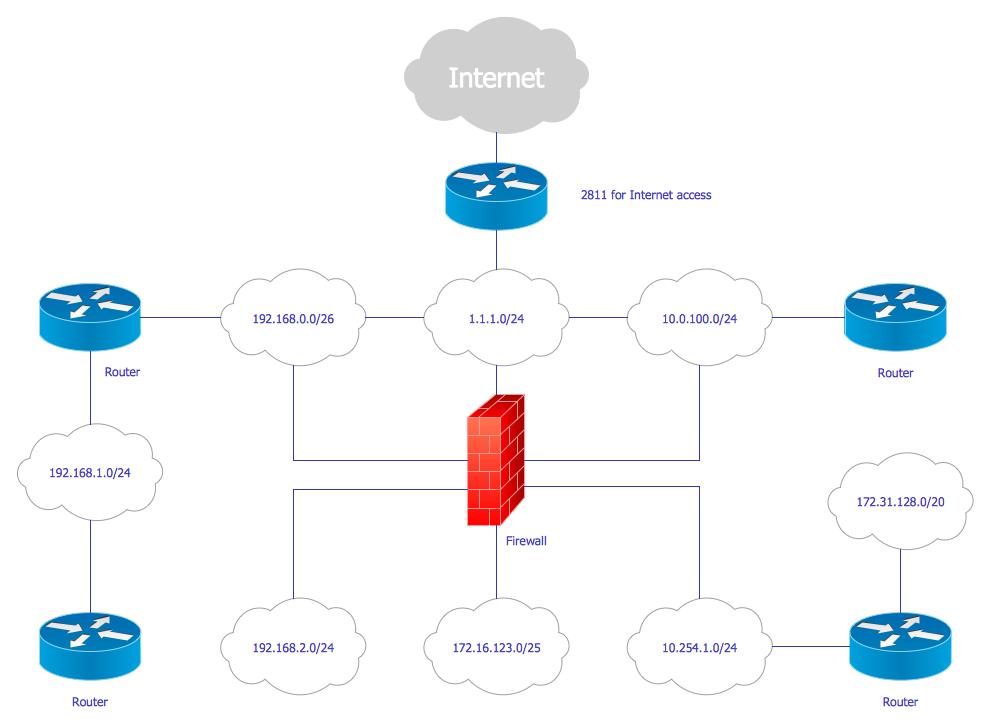
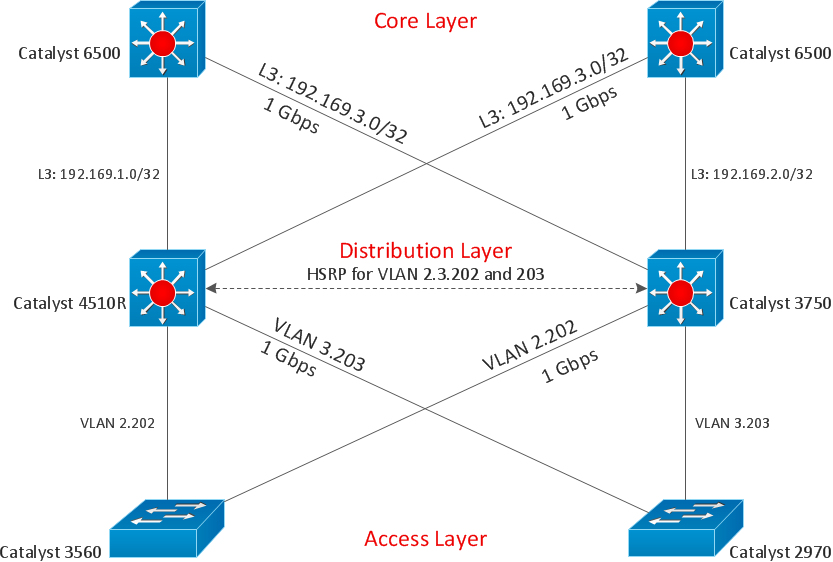
Cisco Network Templates

Cisco has a huge number of enterprise clients in the corporate environment. Therefore many network engineers should draw network diagrams for Cisco hardware.
ConceptDraw has Cisco network diagram templates:

Wireless Mesh Network, Network Organization Chart, Roaming Wireless Local Area Network, Cisco ISG Topology Diagram, Cisco Express Forwarding Sample that facilitates drawing at the initial stage.

However for customizing Cisco network diagrams you can use 13 Libraries like this: Cisco Basic, Cisco Buildings, Cisco IBM, Cisco LAN, Cisco WAN, Cisco Media, Cisco Optical, Cisco People, Cisco Routers, Cisco Security, Cisco Switches&Hub, Cisco Telepresences, etc.

This take great advantage to you for designing Cisco network diagram templates.

Business Diagram Software

ConceptDraw business diagram Software is the most powerful business and relational charting software. Create advanced, completely customizable flow charts, organizational charts, business process diagrams, work flow diagrams, audit diagram, value stream maps, TQM diagrams, ERD diagrams, EPC diagrams, marketing diagrams, cause and effect diagrams, dashboards, infographics and other relational business diagrams from your data.
Business Process Modeling

Network Diagram Software. LAN Network Diagrams. Physical Office Network Diagrams

ConceptDraw Network Diagramming Software with examples of WAN, LAN Diagrams. ConceptDraw Network Diagram is ideal for network engineers and network designers who need to draw Local Area Network diagrams, physical office network diagrams and Diagram for LAN.
How to Draw a Computer Network

Cisco Network Design

ConceptDraw has Cisco network diagram templates and examples for designing:

Cisco Express Forwarding Sample,
Cisco ISG Topology Diagram,
Roaming Wireless Local Area Network,
Network Organization Chart,
Wireless Mesh Network,
etc.

You can use built-in Cisco symbols to customize samples or design Cisco network diagrams, presented in 13 Libraries like this: Cisco Basic, Cisco Buildings, Cisco IBM, Cisco LAN, Cisco WAN, Cisco Media, Cisco Optical, Cisco People, Cisco Routers, Cisco Security, Cisco Switches&Hub, Cisco Telepresence, etc.

Cisco Design

Cisco Network Diagrams solution from the Computer and Networks area of ConceptDraw Solution Park provides 14 libraries with 450 ready-to-use predesigned vector objects that can be used for quickly and easily drawing the professional Cisco Network Diagrams.

Applications

ConceptDraw DIAGRAM is a multipurpose software for business and technical drawing, diagramming, visual documentating.
To understand what practical benefits you can reach with ConceptDraw DIAGRAM take a look at this range of articles. They describe the versatile possibilities of ConceptDraw DIAGRAM expedient applications.

Draw flowcharts, block diagrams, histograms, pie charts, divided bar diagrams, line graphs, circular arrows diagrams, Venn diagrams, bubble diagrams, concept maps, business, draw, diagramming, solution park Basic Diagramming

Draw flowcharts, block diagrams, histograms, pie charts, divided bar diagrams, line graphs, circular arrows diagrams, Venn diagrams, bubble diagrams, concept maps, business, draw, diagramming, solution park
This solution extends ConceptDraw DIAGRAM software with the specific tools you need to easily draw flowcharts, block diagrams, histograms, pie charts, divided bar diagrams, line graphs, circular arrows diagrams, Venn diagrams, bubble diagrams and concept maps

Technical Drawing Software

Technical Drawing Software for drawing technical diagram, electrical and technical drawing. Download Drawing Software ConcepDraw for Free.
ConceptDraw DIAGRAM extended with: Mechanical Engineering Solution, Electrical Engineering Solution, Chemical and Process Engineering Solution from the Industrial Engineering Area is powerful software for business and technical drawing. Its powerful drawing tools, predesigned vector objects, templates, samples are helpful for creation all kinds of Technical Drawings and Technical Diagrams, Electrical and Mechanical Schematics, Circuit and Wiring Diagrams, Structural Drawings, and many other.

Flowchart Software

Flowchart is widely used in business, education and economic presentations to help the audience visualize the content better, or to find flaws in a process flow diagrams. Flowcharts are particularly useful for displaying how a process currently flow or could ideally function. Flowcharts can help you see whether the steps of a process are logical, uncover problems or miscommunications, define the boundaries of a process, and develop a common base of knowledge about a process.

ConceptDraw DIAGRAM flowchart software will help to quickly create new flowcharts, workflow, NS Diagram, BPMN Diagram, Cross-functional flowcharts, data flow diagrams and highlight flowcharts.

Feature-rich flowchart maker, free thousand flowchart examples and templates and colored symbols that will allow you to create professional looking flowcharts simply.

ConceptDraw DIAGRAM supports macOS and Windows.
How to Build a Flowchart

diagram, chart, graph, plot, matrix, geographic, visual, vector, graphic, drawing, Solution Park, ConceptDraw Universal Diagramming Area

diagram, chart, graph, plot, matrix, geographic, visual, vector, graphic, drawing, Solution Park, ConceptDraw
This area collects solutions for drawing diagrams, charts, graphs, matrices, geographic and road maps for education, science, engineering, business.

project, planning, mind mapping, project plan, project management tool PM Easy

project, planning, mind mapping, project plan, project management tool
PM Easy solution extends the ConceptDraw PROJECT functionality with an ability to support neutral methodology of project management and to quickly start a project by listing the task relationships and dependencies, that makes the iterative planning much easier. The project management tool and available visual tools, such as mind mapping, increase the effectiveness of tracking and analysis your project tasks. PM Easy solution from ConceptDraw Solution Park is mainly targeted at project managers in small or medium-sized companies, allowing them to make the project plan and execute projects using mind mapping technique, to implement planning using mind mapping, and to track tasks using ConceptDraw PROJECT application.

?Management Diagrams, Matrixes, Organizational Charts, decision making, scheduling, thinking ideas, problem solving, business planning, company organizing, SWOT analysis Management

?Management Diagrams, Matrixes, Organizational Charts, decision making, scheduling, thinking ideas, problem solving, business planning, company organizing, SWOT analysis
This solution extends ConceptDraw DIAGRAM and ConceptDraw MINDMAP with Management Diagrams and Mind Maps (decision making, scheduling, thinking ideas, problem solving, business planning, company organizing, SWOT analysis, preparing and holding meetings

social media flow chart, social media marketing Social Media Response

social media flow chart, social media marketing
This solution extends ConceptDraw DIAGRAM and ConceptDraw MINDMAP with the ability to draw interactive flow charts with action mind map templates, to help create an effective response to applicable social media mentions.

composition charts Composition Dashboard

composition charts
Composition dashboard solution extends ConceptDraw DIAGRAM software with templates, samples and vector stencils library with charts and indicators for drawing visual dashboards showing data composition.

draw area chart, draw area graph Area Charts

draw area chart, draw area graph
Area Charts are used to display the cumulative totals over time using numbers or percentages; or to show trends over time among related attributes. The Area Chart is effective when comparing two or more quantities. Each series of data is typically represented with a different color, the use of color transparency in an object’s transparency shows overlapped areas and smaller areas hidden behind larger areas.