HelpDesk
How to Draw an Organizational Chart
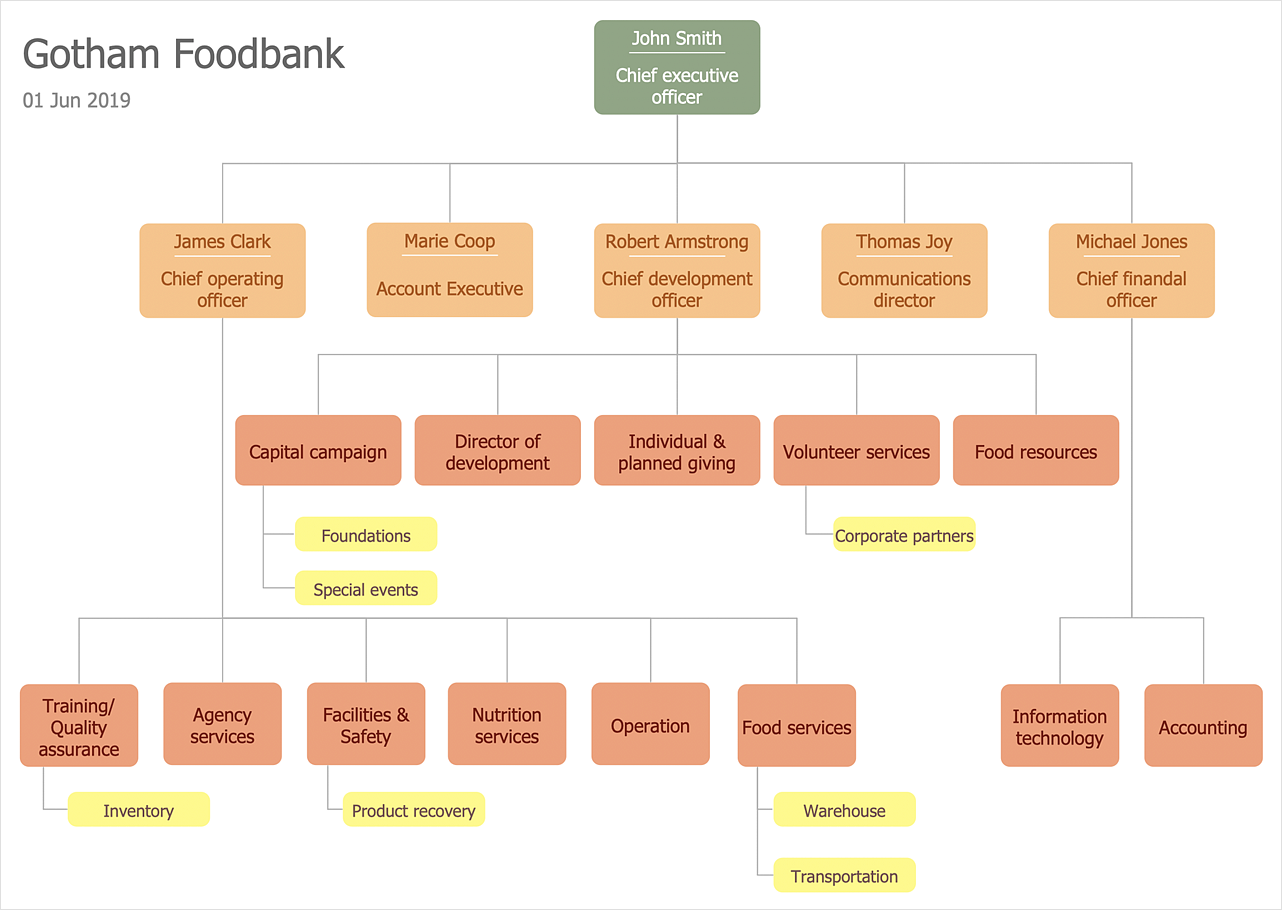
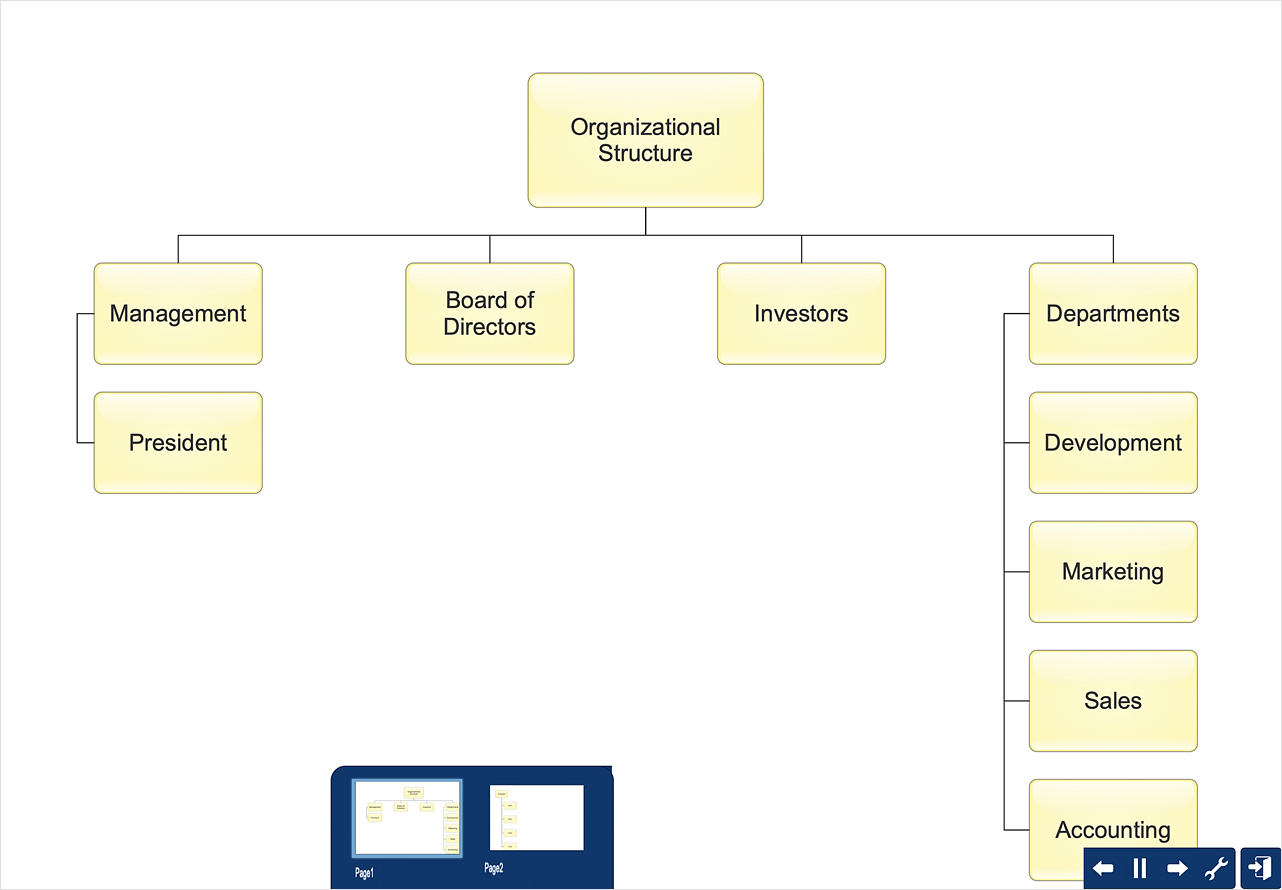
Polish your diagram appearance using the tools provided in the Format panel. The organizational chart software is a valuable tool for modern business. It is important for any business to build a clear organizational structure that determines the responsibilities and relationships between different positions in the organization. The clear structured organization - means the clear structured business workflow, which is the core of success in the business. ConceptDraw DIAGRAM is an org chart software that allows you to draw an organizational structure of your company quickly and easily.HelpDesk
How to Create Organizational Chart Quickly
Use ConceptDraw MINDMAP for generating structured data on organization structure and then ConceptDraw DIAGRAM for presenting the results as chart.HelpDesk
How to Make Different Backgrounds Within a Multipage Drawing
Tips on how to add different backgrounds within single ConceptDraw documentBusiness diagrams & Org Charts with ConceptDraw DIAGRAM
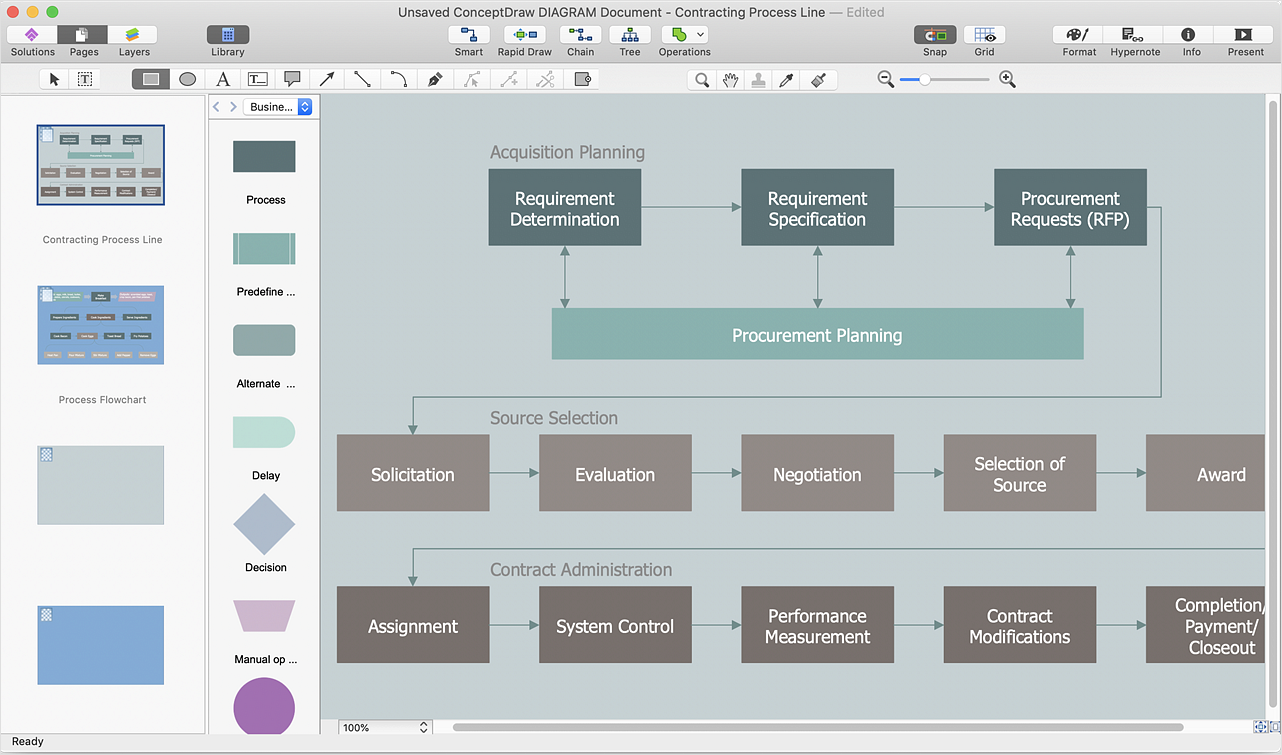
The business diagrams are in great demand, they describe the business processes, business tasks and activities which are executed to achieve specific organizational and business goals, increase productivity, reduce costs and errors. They let research and better understand the business processes. ConceptDraw DIAGRAM is a powerful professional cross-platform business graphics and business flowcharting tool which contains hundreds of built-in collections of task-specific vector stencils and templates. They will help you to visualize and structure information, create various Business flowcharts, maps and diagrams with minimal efforts, and add them to your documents and presentations to make them successful. Among them are Data flow diagrams, Organization charts, Business process workflow diagrams, Audit flowcharts, Cause and Effect diagrams, IDEF business process diagrams, Cross-functional flowcharts, PERT charts, Timeline diagrams, Calendars, Marketing diagrams, Pyramids, Target diagrams, Venn diagrams, Comparison charts, Analysis charts, Dashboards, and many more. Being a cross-platform application, ConceptDraw DIAGRAM is very secure, handy, free of bloatware and one of the best alternatives to Visio for Mac users.
HelpDesk
How to Draw a Line Chart Quickly
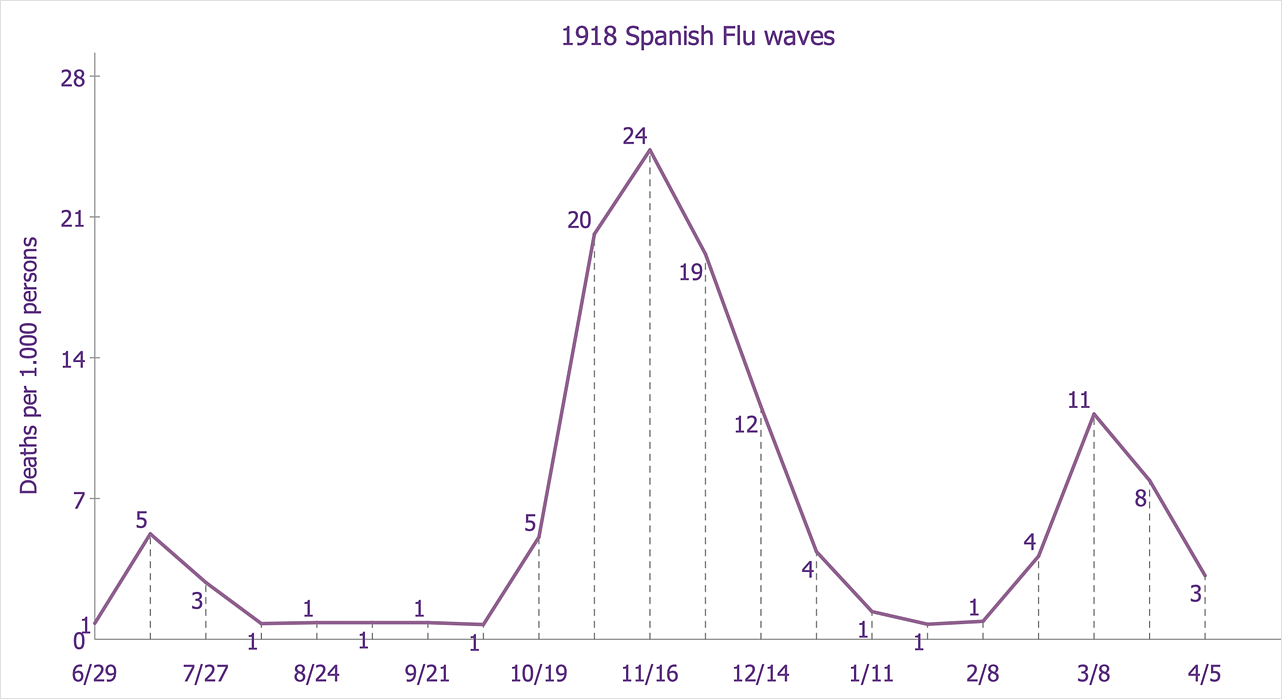
A common line chart is a graphical representation of the functional relationship between two series of data. A line chart that is created by connecting a series of data points together with a straight line is the most basic type of a line chart. A line chart can be used for depicting data that changes continuously over time. It is extensively utilized in statistics, marketing, and financial business. ConceptDraw Basic Line Graph solution provides the possibility to make 2D line charts quickly and effortlessly.HelpDesk
How to Create a Time Series Dashboard
Time Series Dashboard means integration of some type of diagrams: Line Charts, Bar Charts, Column Charts, and Dot Plots on a single space. The ConceptDraw Time Series Dashboard solution can be used to create the interactive Time Series dashboard. The libraries of Time Series Charts solution contain the Live Objects, that can change their appearance depending on the external data. Each chart from the Time Series dashboard displays particular source data. You can include Time Series Charts in your business or technical dashboards to show and compare the items changing over time.HelpDesk
How to Create a Bar Chart
Bar charts (bar graphs) are diagrams displaying data as horizontal or vertical bars of certain heights. Bar charts are widely used to show and compare the values of the same parameters for different data groups. The bar graph can be vertical or horizontal. This depends on the number of categories. There are many methods in which bar graph can be built and this makes it a very often used chart type. Usually, a bar chart is created so that the bars are placed vertically. Such an arrangement means that the bar's height value is proportional to the category value. Nevertheless, a bar chart can be also drawn horizontally. This means that the longer the bar, the bigger the category. Thus, a bar chart is a good way to present the relative values of different measured items. The ConceptDraw Bar Graphs solution allows you to draw a bar chart quickly using a vector library, containing the set of various bar charts objects.- How to Draw an Organization Chart | Organizational Structure ...
- How to Draw an Organization Chart | ConceptDraw PRO ...
- How to Draw an Organization Chart | The Best Drawing Program for ...
- How to Draw an Organization Chart | Organizational Structure ...
- Organizational Structure | How to Draw an Organization Chart ...
- How to Draw an Organization Chart | ConceptDraw PRO ...
- How to Draw an Organization Chart | Pyramid Diagram | Business ...
- How to Draw an Organization Chart | | ConceptDraw PRO ...
- How to Draw an Organization Chart | Pie Chart Examples and ...
- How to Draw an Organization Chart | How to Draw a Flowchart ...
- How to Draw an Organization Chart | ConceptDraw PRO ...
- How to Draw an Organization Chart | ConceptDraw PRO ...
- How to Draw an Organization Chart | Gant Chart in Project ...
- How to Draw a Bubble Chart | ConceptDraw PRO - Organizational ...
- How to Draw an Organization Chart | Organizational Structure | ER ...
- How to Draw an Organization Chart | ConceptDraw PRO ...
- How to Draw an Organization Chart | Business Diagram Software ...
- How to Draw an Organization Chart | Cross-Functional Flowcharts ...
- PM Teams | How to Draw an Organization Chart | How To Plan and ...


