Network Drawing Software


 Cisco Network Diagrams
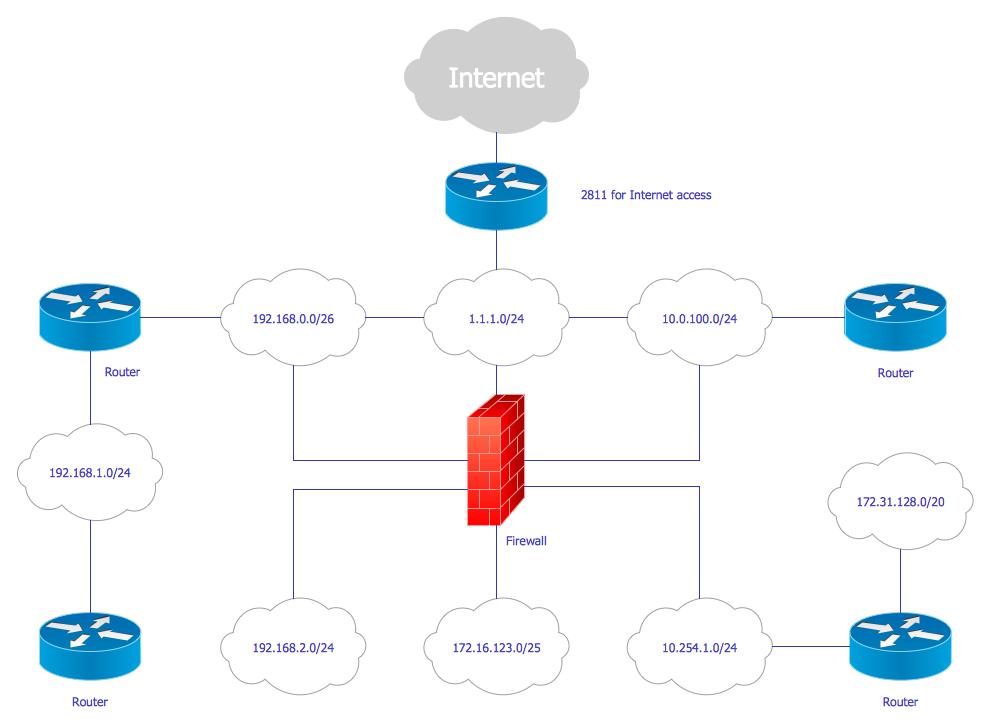
Cisco Network Diagrams solution extends ConceptDraw DIAGRAM with the best characteristics of network diagramming software. Included samples, templates and libraries of built-in standardized vector Cisco network icons and Cisco symbols of computers, network devices, network appliances and other Cisco network equipment will help network engineers, network designers, network and system administrators, as well as other IT professionals and corporate IT departments to diagram efficiently the network infrastructure, to visualize computer networks topologies, to design Cisco computer networks, and to create professional-looking Cisco Computer network diagrams, Cisco network designs and schematics, Network maps, and Network topology diagrams in minutes.
Network Visualization with ConceptDraw DIAGRAM

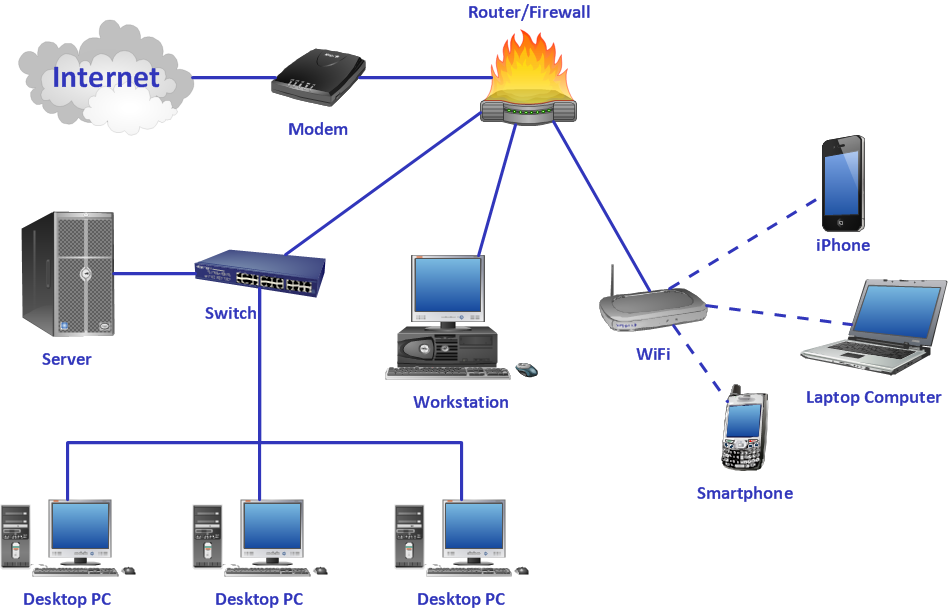
Network Diagram Software. LAN Network Diagrams. Physical Office Network Diagrams

Cisco Network Design
Cisco Network Templates

 Pie Charts
Pie Charts are extensively used in statistics and business for explaining data and work results, in mass media for comparison (i.e. to visualize the percentage for the parts of one total), and in many other fields. The Pie Charts solution for ConceptDraw DIAGRAM offers powerful drawing tools, varied templates, samples, and a library of vector stencils for simple construction and design of Pie Charts, Donut Chart, and Pie Graph Worksheets.
 Cross-Functional Flowcharts
Cross-functional flowcharts are powerful and useful tool for visualizing and analyzing complex business processes which requires involvement of multiple people, teams or even departments. They let clearly represent a sequence of the process steps, the order of operations, relationships between processes and responsible functional units (such as departments or positions).
 Accounting Flowcharts
Accounting Flowcharts solution extends ConceptDraw DIAGRAM software with templates, samples and library of vector stencils for drawing the accounting flow charts.
 Organizational Charts
Organizational Charts solution extends ConceptDraw DIAGRAM software with samples, templates and library of vector stencils for drawing the org charts.
 Fishbone Diagram
Fishbone Diagrams solution extends ConceptDraw DIAGRAM software with templates, samples and library of vector stencils for drawing the Ishikawa diagrams for cause and effect analysis.
 Flowcharts
The Flowcharts solution for ConceptDraw DIAGRAM is a comprehensive set of examples and samples in several varied color themes for professionals that need to represent graphically a process. Solution value is added by the basic flow chart template and shapes' libraries of flowchart notation. ConceptDraw DIAGRAM flow chart creator lets one depict the processes of any complexity and length, as well as design the Flowchart either vertically or horizontally.
 Area Charts
Area Charts are used to display the cumulative totals over time using numbers or percentages; or to show trends over time among related attributes. The Area Chart is effective when comparing two or more quantities. Each series of data is typically represented with a different color, the use of color transparency in an object’s transparency shows overlapped areas and smaller areas hidden behind larger areas.
 Universal Diagramming Area
This area collects solutions for drawing diagrams, charts, graphs, matrices, geographic and road maps for education, science, engineering, business.
Crea Diagramas De Flujo
 Audit Flowcharts
Audit flowcharts solution extends ConceptDraw DIAGRAM software with templates, samples and library of vector stencils for drawing the audit and fiscal flow charts.
- How to Draw an Organization Chart | How to Draw a Computer ...
- Computer and Networks Area | Simple & Fast Diagram Software ...
- Network organization chart | Network Visualization with ...
- Cisco Network Templates | Network organization chart | Cisco ...
- Network Drawing Software | Network Diagram Software | Illustrate ...
- Picture Graphs | SWOT Sample in Computers | Computer Network ...
- ConceptDraw PRO Network Diagram Tool | Computer and Networks ...
- Communication network diagram | Mobile satellite communication ...
- ConceptDraw PRO The best Business Drawing Software | Network ...
- Network Diagram Examples | Cisco Network Design | 3D Network ...
- Network Diagram Examples | Network Architecture | Network Layout |
- Computer Network Architecture | How to Draw a Computer Network ...
- Network Drawing Software | Pyramid Diagram | Pyramid Diagram |
- Computer network system design diagram | Computer and Networks ...
- Network Diagram Software | ConceptDraw PRO Network Diagram ...
- Diagramming software for Amazon Web Service diagrams, charts ...
- Network Diagram Software | Network Drawing Software | Network ...
- Communication Diagram UML2.0 / Collaboration UML1.x | Network ...
- Network floor plan layout
- Network Layout Floor Plans