Sample 1. Computer network system design diagram.
ConceptDraw DIAGRAM diagramming software provides vector shapes and connector tools for quick and easy drawing diagrams for business, technology, science and education.
Use ConceptDraw DIAGRAM enhanced with solutions from ConceptDraw Solution Park to create diagrams to present and explain structures, process flows, logical relationships, networks, design schemes and other visually organized information and knowledge.
NINE RELATED HOW TO's:
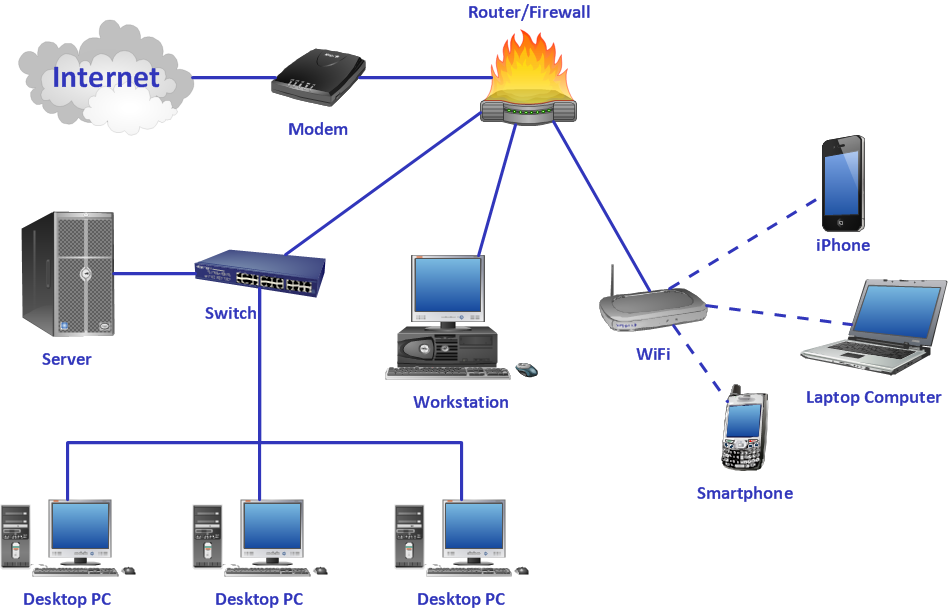
Communication via Internet nowadays is almost irreplaceable part of lifestyle. It’s needless to say that providing that communication is not a piece of cake, and network diagram software is useful for representing all the interconnections between network devices. These diagrams are also helpful for educational purposes.
This drawing depicts the network topology of the sample web studio. This is a physical type of network diagram. It is depicting the network, end-user equipment and connections between them. The given network has combined the both star and mesh network topology features. This diagram is a tool of network administrator. it delivers the actual information on location of servers, hubs, switches, routers, and other telecommunication equipment. The collection of network related symbols provided with ConceptDraw Network Diagrams solution represents the entire network components. All Symbols are standard. Therefore, network specialists can effortlessly decrypt this diagram.
Picture: Network Diagram Software
Related Solution:
This sample shows the UML Class Diagram that was created in ConceptDraw DIAGRAM on the Mac and then was opened for editing in MS Visio.
Using the 13 libraries of the Rapid UML Solution for ConceptDraw DIAGRAM you can create your own visual vector UML diagrams quick and easy.
Picture: UML Diagram Visio
Related Solution:
The VMware vNetwork Distributed Switch (vDS) is the new virtual switch (vSwitch) with vSphere 4 that extends the set of features of the VMware vNetwork Standard Switch (vSS). The VMware vSS is the base-level virtual networking alternative that extends the capabilities, configuration and appearance of the standard vSwitch in VMware ESX 3.5 to ESX 4.0 and vSphere 4.
This example was created in ConceptDraw DIAGRAM using the Computer and Networks Area of ConceptDraw Solution Park and shows the VMware vDS network diagram.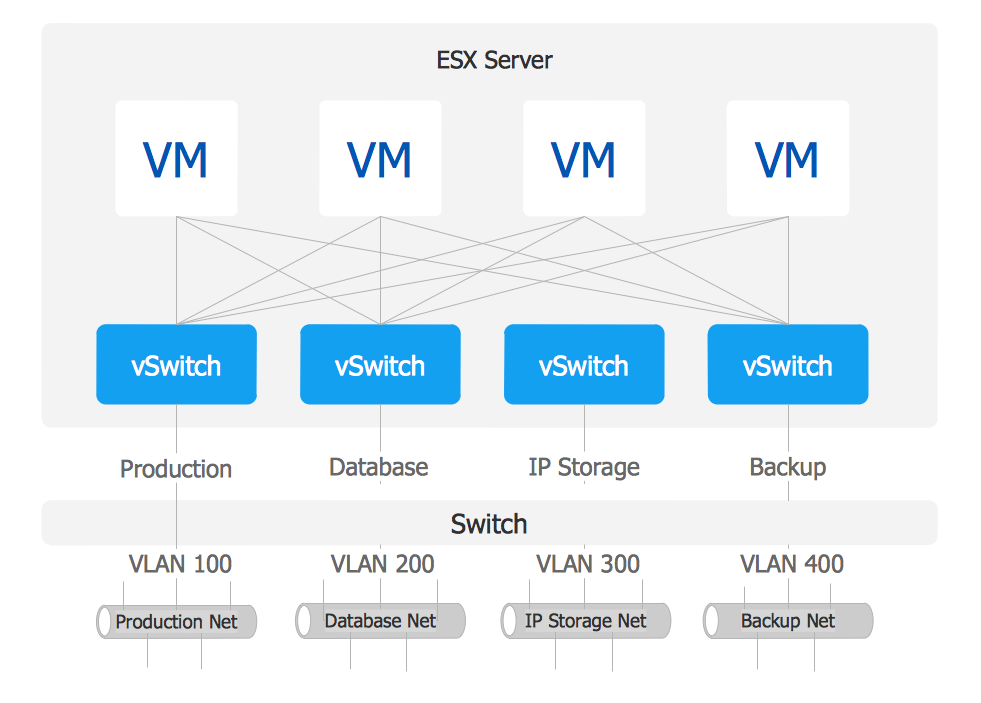
Picture: VMware vNetwork Distributied Switch (vDS). Computer and Network Examples
Related Solution:
ConceptDraw helps you to start designing your own UML Collaboration Diagrams with examples and templates.
Picture: Diagramming Software for Design UML Collaboration Diagrams
Use Case Diagrams technology. IDEF4 standard implies not only graphical presentation but the additional information about diagrams of heredity, methods systematization and types which are contained in specifications.
Picture: IDEF4 Standard
Working with information can be quite tedious, furthermore, some data can be quite difficult to perceive without any graphic representation. So, to facilitate your work, you can use business diagrams, such as simple flowcharts or Gantt charts for project management and orgcharts for clarifying your company structure. You can use a proper software, like ConceptDraw Pro, draw them on paper, or use whiteboards, but it is more convenient to use a digital tool.
This diagram shows a cross-functional flowchart that was made fore telecom service provider. A workflow of a common telecommunication service provider has a rather branched structure. Thus, it is useful to have a flow chart to visualize the sequences and interrelations of the work flow steps. Business process flowchart contains 17 processes and 4 decision points,that are distributed through 2 lines depicting the participants involved. Also there are connectors that show the data flow within processes. This flowchart displays a detailed model of the telecom service trading process, as well as all participants in the process and how they interact with each other.
Picture: Business diagrams & Org Charts with ConceptDraw DIAGRAM
The ConceptDraw Flowchart component includes a set of samples and templates. This geathered as flowchart maker toolbox which focused on drawing flowcharts of any industry standards.
Picture: Flowchart Components
Related Solution:
A Process Flow Diagram (PFD) is a diagram which shows the relationships between the main components in a system. Process Flow Diagrams are widely used by engineers in chemical and process engineering, they allows to indicate the general flow of plant process streams and equipment, helps to design the petroleum refineries, petrochemical and chemical plants, natural gas processing plants, and many other industrial facilities.
ConceptDraw DIAGRAM diagramming and vector drawing software extended with powerful tools of Flowcharts Solution from the Diagrams Area of ConceptDraw Solution Park is effective for drawing: Process Flow Diagram, Flow Process Diagram, Business Process Flow Diagrams.
Picture: Process Flow Diagram
Related Solution:
Are you sure that the process of creating the Cisco network diagrams is very complex? Verify back with the help of ConceptDraw DIAGRAM software extended with Cisco Network Diagrams Solution from the Computer and Networks Area. All powerful drawing tools, each Cisco icon, template, sample will be very helpful for you.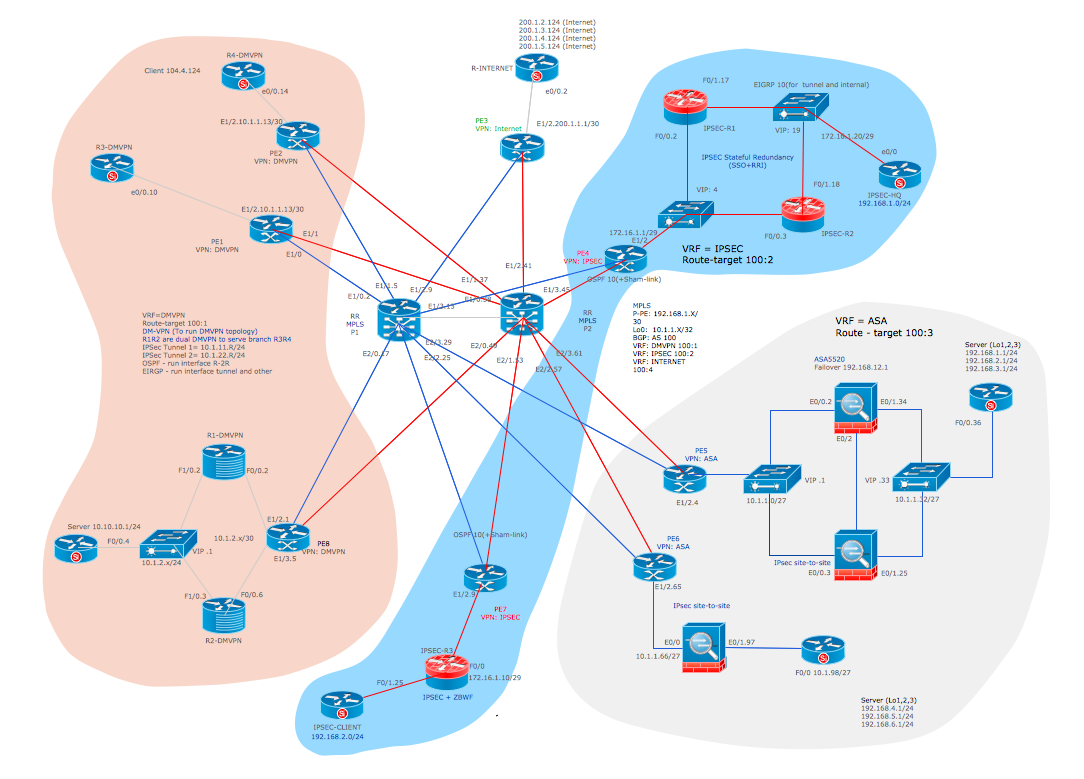
Picture: Cisco Icon
Related Solution: