This site uses cookies. By continuing to browse the ConceptDraw site you are agreeing to our Use of Site Cookies.

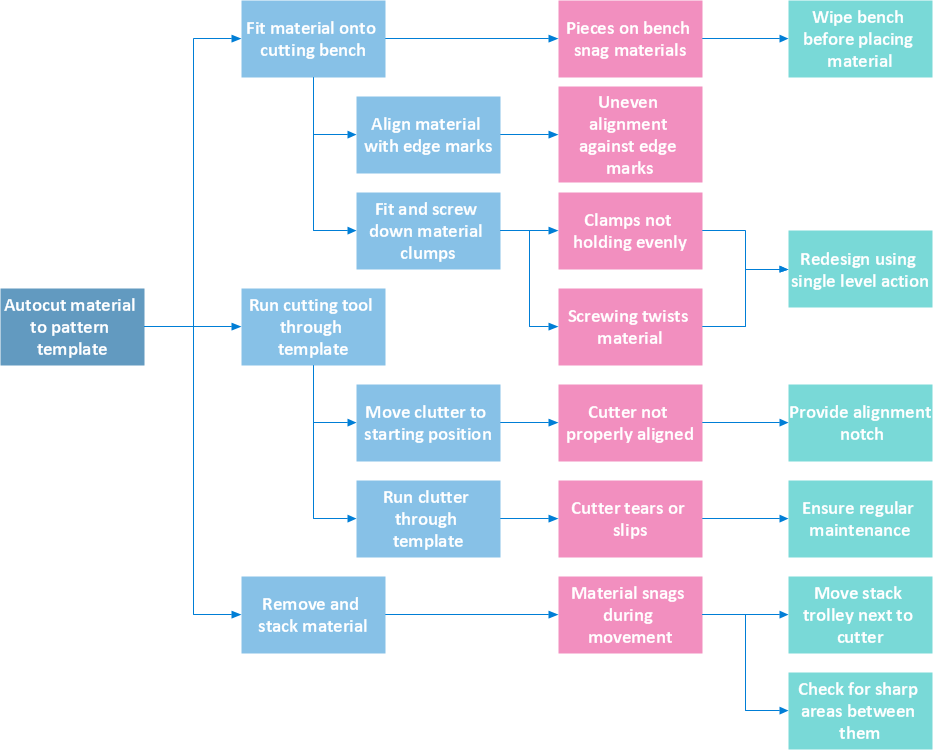
CORRECTIVE ACTIONS PLANNING. Risk Diagram (PDPC)

Risk Diagram (PDPC) - ConceptDraw OFFICE suite is a software for Risks Diagram making. This diagram identifies possible risks in accomplishing corrective actions. With the Risks Diagram, one analyzes each action separately in a tree of all actions and develops a preventive action in response of each potential obstacles or circumstances which may be a risk.
7MP Tools
7MP Tools
HelpDesk

How To Create Risk Diagram (PDPC) Using Solutions

Risk diagram is used to identify possible risks in accomplishing corrective actions. With the Risks diagram, one analyzes each action separately in a tree of all actions and develops a preventive action in response to each potential obstacles or circumstances which may be a risk. The ability to create a Risk diagram from a mind map is supported by the ConceptDraw Seven Management and Planning Tools solution. This article describes how to identify possible risks when carrying out corrective actions, and define preventive actions.

Risk Analysis

Risk Analysis. ConceptDraw OFFICE suite is a software for decision making. The Seven Management and Planning Tools is a tool for Risks Diagram drawing. This diagram identifies possible risks in accomplishing corrective actions. With the Risks Diagram, one analyzes each action separately in a tree of all actions and develops a preventive action in response of each potential obstacles or circumstances which may be a risk.

CORRECTIVE ACTIONS PLANNING. PERT Chart

The PERT Chart is constructed as part of the process in creating a schedule of corrective actions. The PERT Chart shows the logical connections and consequence of tasks to be performed. It displays the time period for problem solving and the implementation of all activities through the critical path.
ConceptDraw Office suite is a software for corrective actions planning.
7MP Tools
7MP Tools

Financial Comparison Chart

This sample shows the Bar Chart of the leverage ratios for two major investment banks. The leverage ratio is the ratio of the total debt to the total equity; it is a measure of the risk taken by the bank. The higher of the leverage ratio denotes the more risk, the greater risks can lead to the subprime crisis.
HelpDesk

How to Manage Problem Solving Using Seven Management and Planning Tools

The Seven Management and Planning Tools solution can be used as an extension to the ConceptDraw DIAGRAM software enabling to create Affinity Diagrams, Relations Diagrams, Prioritization Matrices, Root Cause Analysis Tree Diagrams, Involvement Matrices, PERT Charts, and Risk Diagrams.
7 MP Tools
7 MP Tools

Preventive Action

Preventive Action - ConceptDraw OFFICE suite is a software for the Preventive Action making. The Seven Management and Planning Tools solution is a set of such tools for problems preventive actions via investigating of the core problem.
Skilled use of these diagrams makes collaborative teamwork both more engaging and more effective.

Activity Network (PERT) Chart

Activity Network and Project Evaluation and Review Technique, or PERT, charts are a way of documenting and analyzing the tasks in a project.
This diagram is constructed as part of the process in creating a schedule of corrective actions. The Activity Network Chart (PERT) shows the logical connections and consequence of tasks to be performed. It displays the time period for problem solving and the implementation of all activities through the critical path.

The Best Flowchart Software Available

ConceptDraw gives the ability to draw Flowchart documents. Flowcharts solutionis a powerful tool that extends ConceptDraw application for drawing business flowcharts.
ConceptDraw DIAGRAM vector diagramming and business graphics software enhanced with with templates, green and interactive flowchart makers, samples and stencil libraries from ConceptDraw Solution Park which all focused to help with drawing flowcharts, block diagrams, bar charts, histograms, pie charts, divided bar diagrams, line graphs, area charts, scatter plots, circular arrows diagrams, Venn diagrams, bubble diagrams, concept maps, and others.

Relative Value Chart Software

Relative value is a value measured in the terms of liquidity, risks, return of one investment or financial instrument relative to another.
Relative values are widely used in:business, economics, investment, management, marketing, statistics, etc.
ConceptDraw DIAGRAM software is the best for drawing professional looking Relative Value Charts. ConceptDraw DIAGRAM provides Divided Bar Diagrams solution from the Graphs and Charts Area of ConceptDraw Solution Park.

PDPC

ConceptDraw DIAGRAM extended with Seven Management and Planning Tools Solution from the Management Area of ConceptDraw Solution Park is the best software for drawing all types of diagrams from the Seven Management and Planning Tools: Affinity Diagram, Relations Diagram, Prioritization Matrix, Root Cause Analysis Tree Diagram, Involvement Matrix, PERT Chart, and Risk Diagram (PDPC).

The Action Plan

Action Plan - For the action planning define people and groups involvement in corrective actions by roles, identify logical sequences of scheduled actions and critical path of problem solving, identify possible risks of action plan and propose preventive actions.
ConceptDraw Office suite is a software for decision making and action plan.
7MP Tools
7MP Tools

Work Order Process Flowchart. Business Process Mapping Examples

Create your own cross-functional flow charts of order processing steps using variety of vector objects from the libraries of Business Process Mapping Solution for ConceptDraw DIAGRAM Business Mapping Software and also collection of Business Process Maps, Flowcharts, Swim Lanes Diagrams and SIPOC Diagrams, and template from ConceptDraw STORE to create your own professional looking diagrams
The cross-functional flow chart example shows business process mapping of the real property work order.

PERT Chart Software

PERT Chart Software - Activity Network and Project Evaluation and Review Technique, or PERT, charts are a way of documenting and analyzing the tasks in a project.
ConceptDraw DIAGRAM is a powerful diagramming and vector drawing software for designing professional looking PERT Charts quick and easy.