Spider Chart Template
This sample shows the Spider Chart that represents the budget and spending for one organization and allows to compare them. The multivariate data are represented on the Spider Chart as a two-dimensional chart with four or more variables displayed on the axes that start in one point. The Spider Charts are used in the management, business and sport.Block Diagram Creator
A block diagram is a diagram of a system in which the principal parts or functions are represented by blocks connected by lines that show the relationships of the blocks. ConceptDraw DIAGRAM diagramming and vector drawing software extended with Block Diagrams Solution from the "Diagrams" Area is a powerful Block Diagram Creator.Column Chart Template
Column chart templates from ConceptDraw collection can help you find the best visual depiction for you data. You can easily modify column chart templates according to data you want to visualize.Chart Maker for Presentations
Easy charting software comes with beautiful chart templates and examples. This makes it easy to create professional charts without prior experience.Flow Chart Creator
ConceptDraw DIAGRAM is a flowchart design software. There are large collections of professional flowchart symbols for process flow diagrams, standard flowchart symbols and colored basic flowchart symbols. Built-in examples and video lessons allow users to get started immediately and do drawing of virtually any type of flowchart or process flow diagramsScatter Chart Analysis. Scatter Chart Example
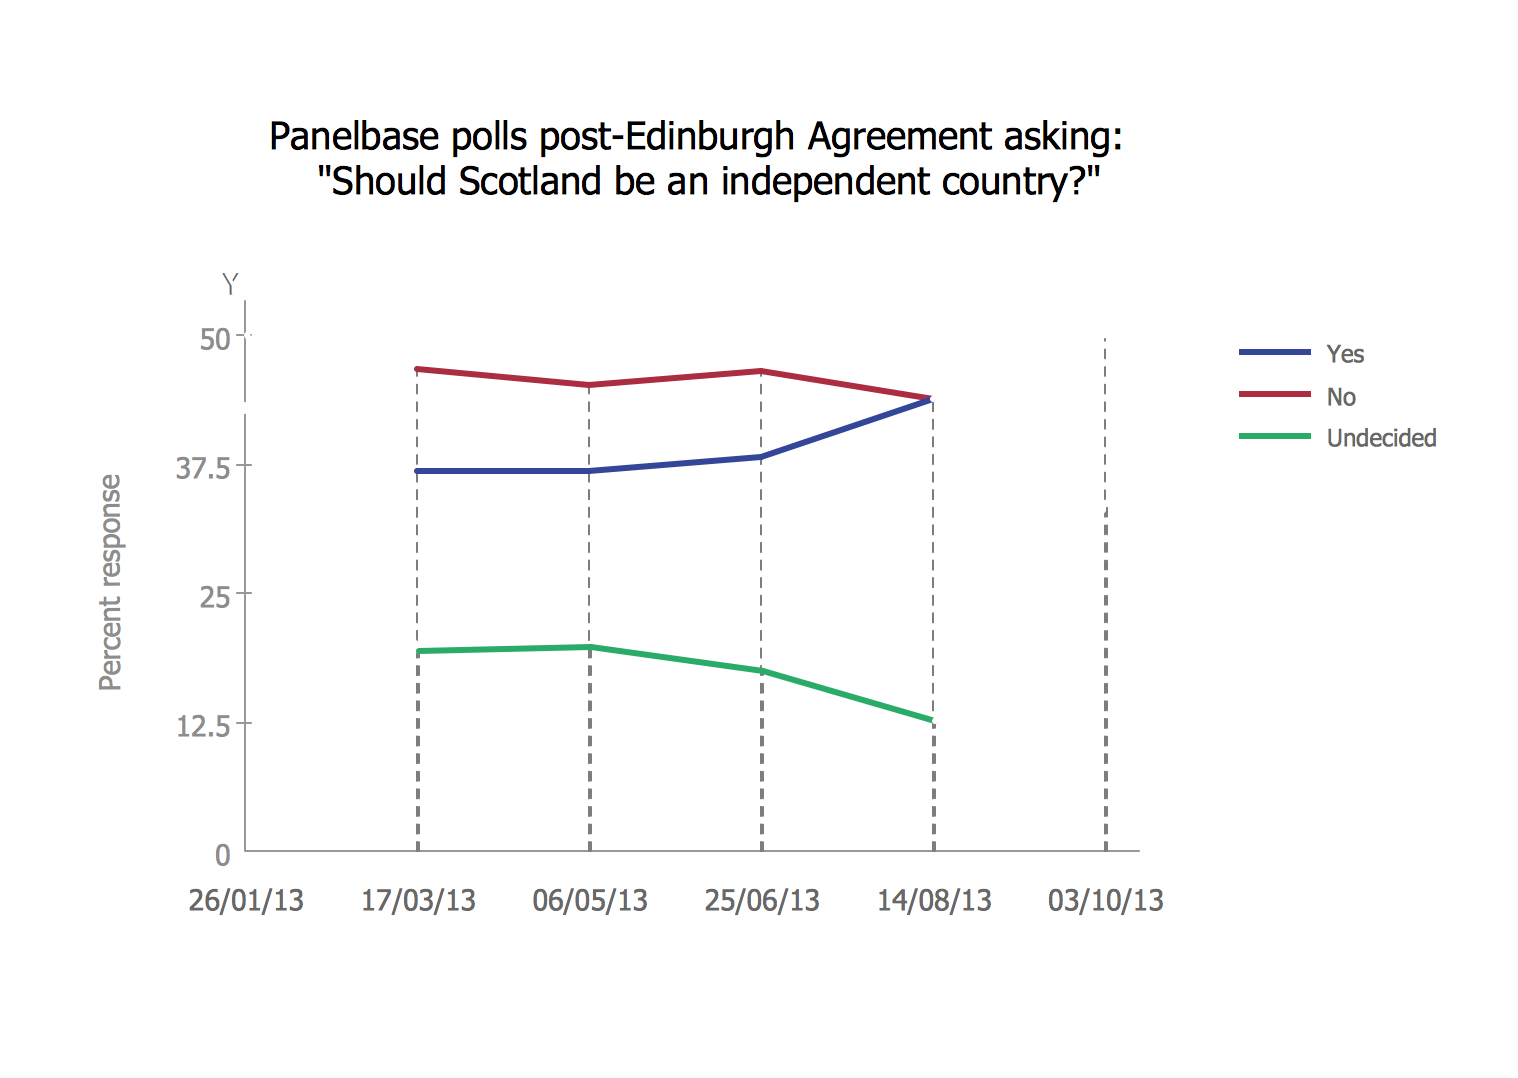
This sample shows the Scatter Chart that displays the polls on the referendum 2014 in Scotland. On this Scatter Chart the data are represented as points with two values of variables in the Cartesian coordinates. The points are connected by lines. This diagram can be useful in different opinion polls, referendums, for creating the reports.HelpDesk
How to Create Marketing Diagrams
Marketing diagrams created in ConceptDraw DIAGRAM are a great tool to communicate marketing messages and simplify visualization of large amounts of data. Marketing diagrams can be used to show and analogize market-related data and relationships, and to monitor market variability over time.HelpDesk
How to Create a Funnel Diagram
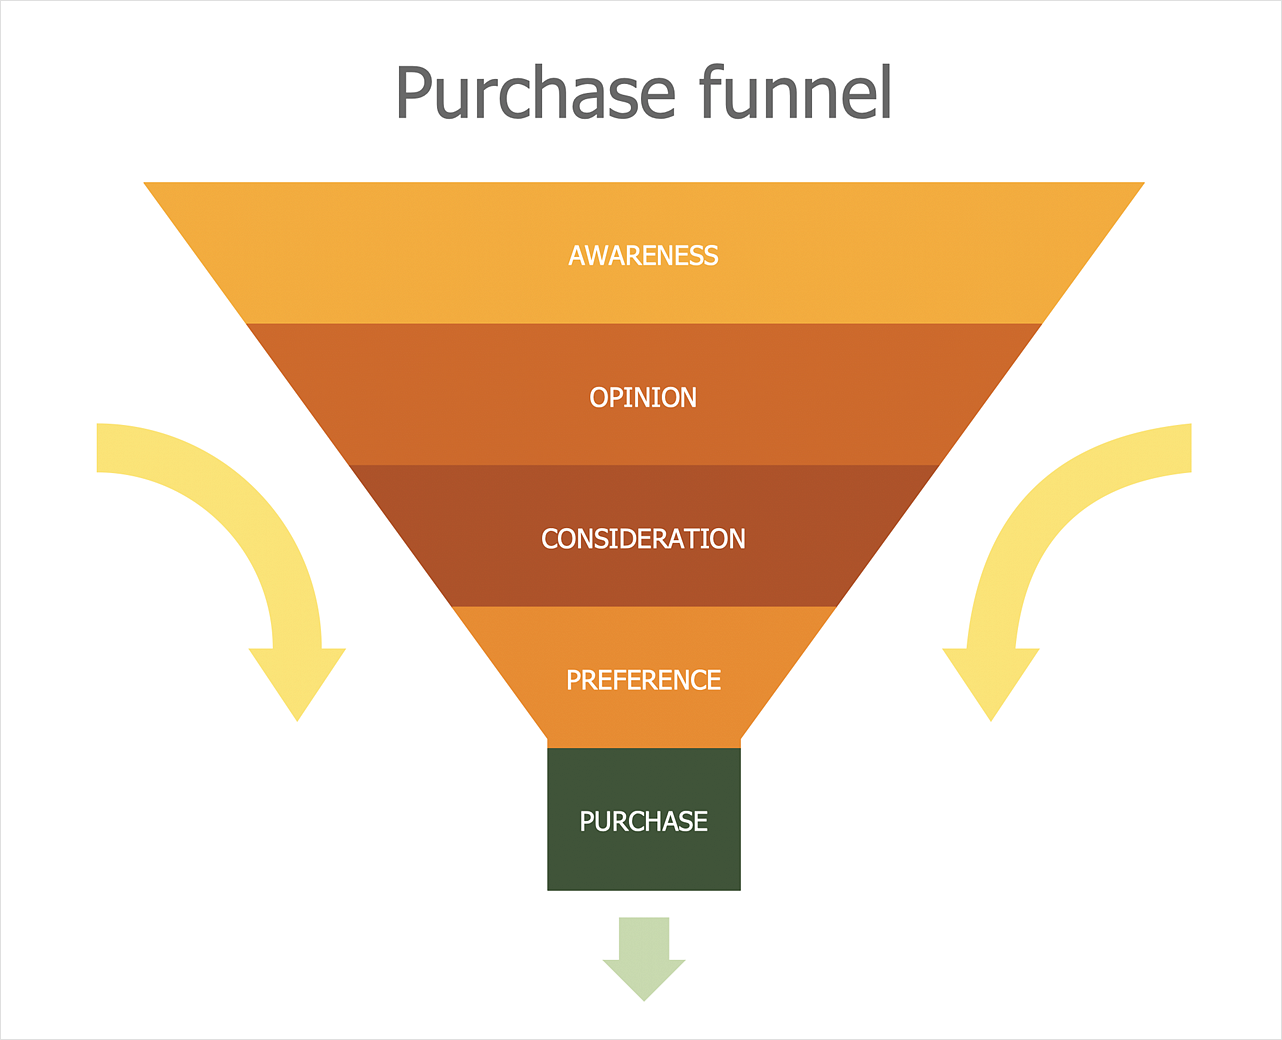
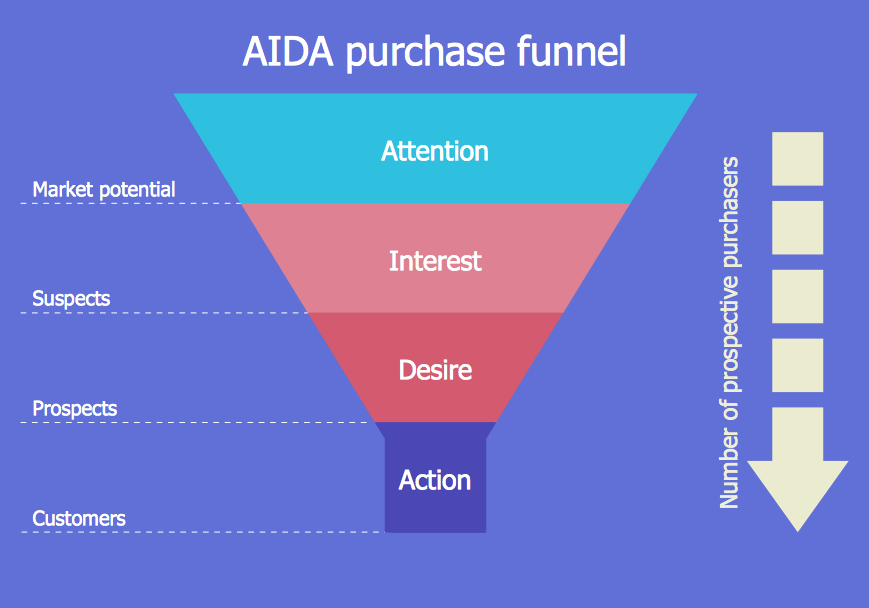
Marketing diagrams created in ConceptDraw DIAGRAM are a great tool to communicate marketing messages and simplify visualization of large amounts of data. The Marketing and Sales funnel is useful for monitoring the progress and success of advertising and marketing campaigns, for determining the number of customers that move to the next stage or disappear at each stage, for calculating the company's potential performance by stages, for tracking performance indicators for identifying the bottlenecks in the process and for large range of other tasks.Blank Scatter Plot
This sample shows the Scatter Plot without missing categories. It’s very important to no miss the data, because this can have the grave negative consequences. The data on the Scatter Chart are represented as points with two values of variables in the Cartesian coordinates. This sample can be used in the engineering, business, statistics, analytics, at the creating the financial and other types of reports.Stakeholder Mapping Tool
Stakeholders are the groups of people or organizations whose contribution matters to the organization's success, this can be labour participation, financial participation, dissemination of information about organization, etc. So, the employees of the company, its suppliers, customers, media, public organizations, state authorities, all they are stakeholders of the company. ConceptDraw DIAGRAM diagramming and vector drawing software extended with Stakeholder Onion Diagrams Solution from the Management Area of ConceptDraw Solution Park is a powerful stakeholder mapping tool which allows easy create Stakeholder Onion diagrams and maps depicting the layers of a project, relationships of stakeholders to a project goal, and relationships between stakeholders.HelpDesk
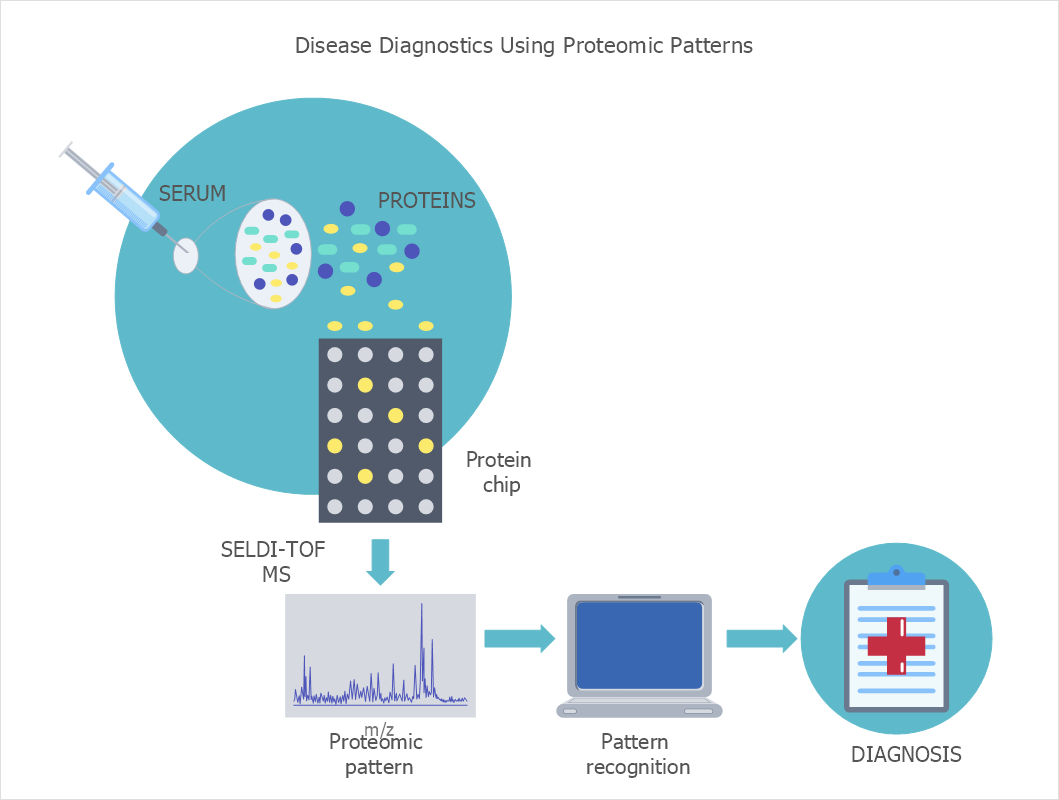
How to Create a Health Informatics Diagram
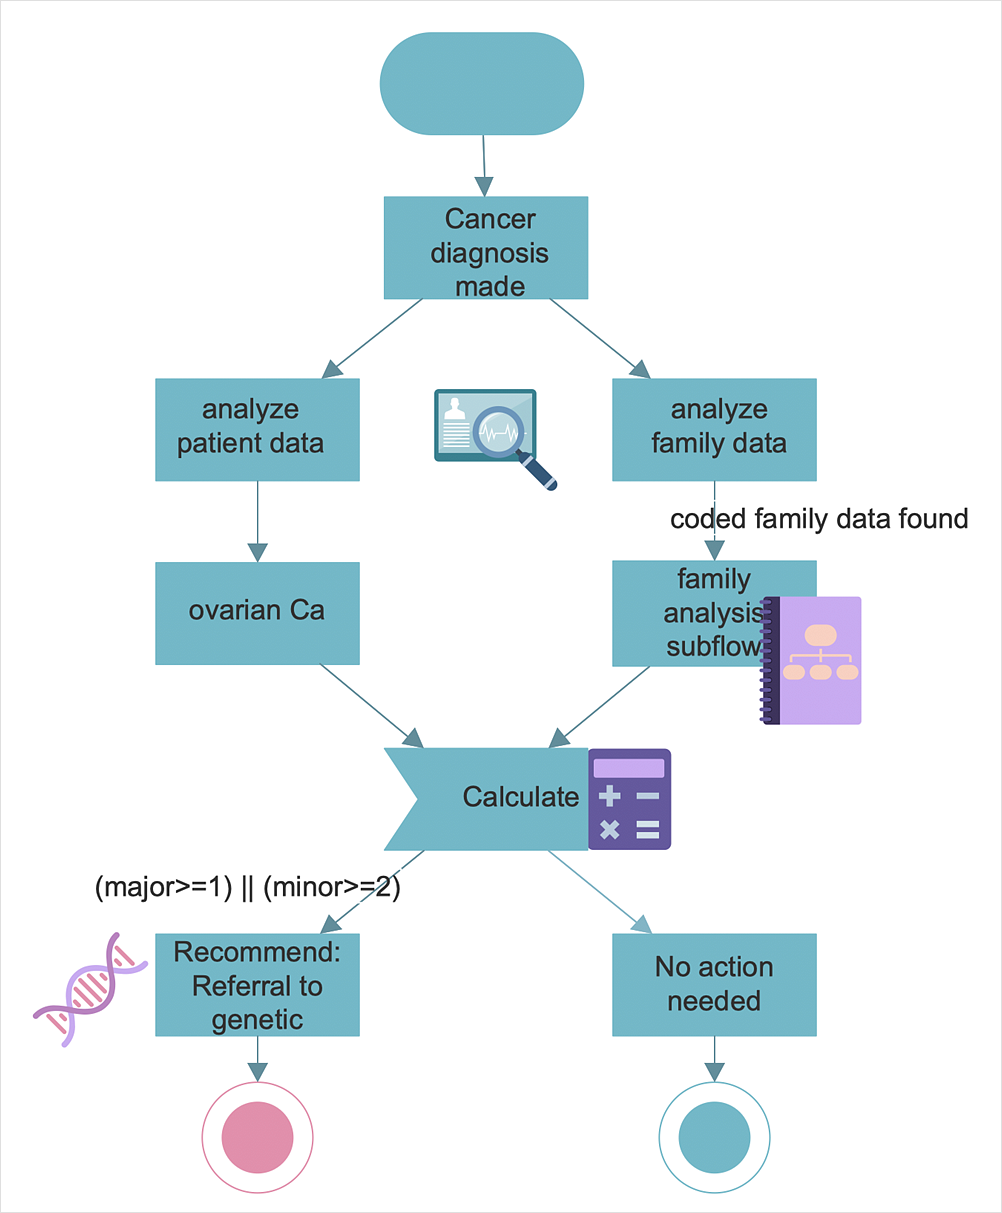
The ability to create Health Informatics Workflow diagrams is provided with the ConceptDraw Health Informatics solution. It includes 33 vector graphics icons and 10 sample documents that can be used when representing the flow of data, documents, and tasks during the performance of a health management process.Risk Diagram (Process Decision Program Chart)
The Risk Diagram or Process Decision Program Chart (PDPC) is intended to determine the risks of potential obstacles during the corrective actions that can be at the cases of their incorrect performing, and helps to develop effective preventive actions. Process Decision Program Chart it's kind of contingency plan to limit the risks, it determines the consequential impacts of failures on the activity plans. The Risk Plans and Process Decision Program Charts can be extended on several levels and take the form of tree or hierarchy, this form is incredibly convenient for representing the risks and countermeasures. ConceptDraw MINDMAP is powerful software tool for Business, Marketing and Project Management. It is also ideal for easy designing MINDMAP Risk Diagram or Process Decision Program Chart, due to the included "7 Management and Planning Tools" solution to ConceptDraw Solution Park. We recommend to start with Process Decision Program Chart (PDPC) template opening it from ConceptDraw STORE or from the Output tab at ConceptDraw MINDMAP application.HelpDesk
How to Design Biomedical Drawings
The Biomedicine Solution supplies the ConceptDraw DIAGRAM users with an abundance of samples and libraries of vector biomedical icons, pictograms of biomedical sciences and biomedical technologies. It contains, 137 graphic icons compiled into 3 vector libraries.Circle Spoke Diagram Template
ConceptDraw DIAGRAM diagramming and vector drawing software offers the Circle Spoke Diagram Template included in the Circle-Spoke Diagrams Solution from the "Diagrams" Area. Use of ready template is the easiest way of drawing professional looking Circle-Spoke Diagrams.How to Draw an Effective Flowchart
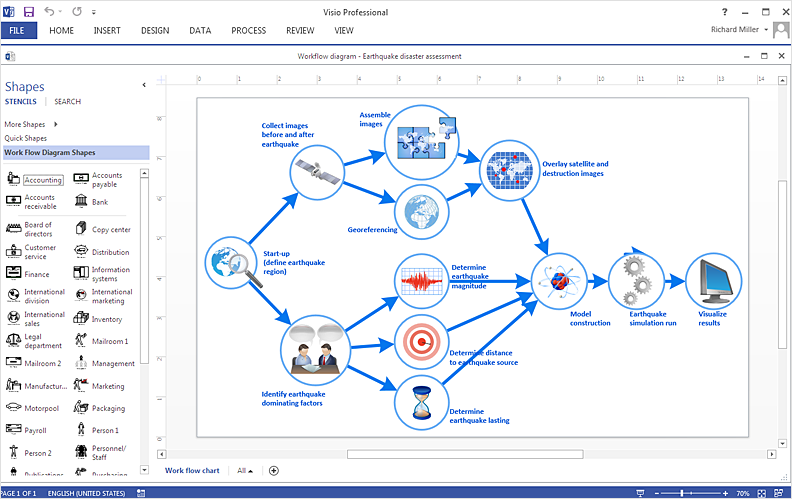
Use ConceptDraw DIAGRAM diagramming and business graphics software to draw your own flowcharts of business processes.Workflow Diagram Template
Starting producing workflow diagram from template you save time and avoid the blank page syndrome. At first, the workflow template is set of rules for a workflow. The workflow symbols used in the specific case are part of workflow template. This is the subset of large standard collections of workflow symbols. The first part of workflow template is identification of symbols allowed in use in your specific case. The best way would be to collect them in your customized drawing collection of workflow symbols which used in your specific cases of workflow diagrams. Another way to create business process documents is using business process flow diagram which have similar purposes and have different visual notation. ConceptDraw DIAGRAM is professional workflow diagram software with the rich extentions from ConceptDraw Solution Park. The basic solution for workflow diagramming is Workflow Diagrams Solution. It delivers a rich set of workflow diagram templates and samples help you draw diagrams eRadar Chart
This sample shows the Radar Chart that compares the internet dimensions in the four countries. The Radar Chart represents the multivariate data as a two-dimensional chart with three or more variables displayed on the axes that start in one point. The Radar Charts are used in the quality management, business, analytics and sport.SWOT Analysis Tool for Small Business
SWOT analysis is effective method of making the plan to evaluate the Strengths, Weaknesses, Opportunities, and Threats involved in a project. SWOT analysis includes the specifying project objectives and attentive identifying the internal and external causes for accomplishing the main project goals. It is actively used in large and small business project management for effective and clear identifying the critical factors. SWOT and TOWS Matrix Diagrams solution is included to ConceptDraw Solution Park and contains the high-quality analysis tools. This graphical solution turns the ConceptDraw DIAGRAM software in an excellent marketing management and advertising agency software, the best SWOT analysis tool for small business or large, as you like and need. Included graphic tools, visual and project planning components make it the best marketing project management software for marketing project planning and for making marketing presentations. Use the ConceptDraw DIAGRAM to create professional and well-designed SWOT matrices in minutes.PDPC
ConceptDraw DIAGRAM extended with Seven Management and Planning Tools Solution from the Management Area of ConceptDraw Solution Park is the best software for drawing all types of diagrams from the Seven Management and Planning Tools: Affinity Diagram, Relations Diagram, Prioritization Matrix, Root Cause Analysis Tree Diagram, Involvement Matrix, PERT Chart, and Risk Diagram (PDPC).HelpDesk
How To Create a Workflow Diagram in Visio
A workflow diagram shows a working process as a set of related events that follow each other in a particular order. They are usually created as flowcharts, with shapes that represent steps in the process connected by arrows that indicate the next step. Making a business process diagram involves many elements that can be managed using ConceptDraw DIAGRAM. The ability to design workflow diagrams is delivered by the Workflow Diagrams solution. ConceptDraw DIAGRAM allows you to easily create workflow diagrams and then make an MS Visio file from your diagrams. Using ConceptDraw DIAGRAM, you can export your workflow diagrams to MS Visio VSDX and VDX files.- Bubble Chart Maker | Bubble Diagrams | Bubble Chart | Free Blank ...
- Spider Chart Template | Percentage Spider Chart | Chart Maker for ...
- Spider Chart Template | Percentage Spider Chart | Chart Maker for ...
- Chart Maker for Presentations | Line Graph | Blank Calendar ...
- Bar Graph | Bar Chart Template for Word | Bar Graphs | Blank Bar ...
- Blank Orchestra Seating Chart
- Bubble Chart Maker | Flow Diagram Software | Bubble Diagrams ...
- Blank Calendar | Bubble Chart | Lean Manufacturing Diagrams | Plot ...
- Scatter Diagrams | Blank Scatter Plot | How to Draw a Scatter ...
- Spider Chart Template | Chart Maker for Presentations | Percentage ...
- Venn Diagrams | Economics Graph Maker Online
- Calendars | Business diagrams & Org Charts with ConceptDraw ...
- Physics Diagrams | Bubble Chart | Blank Calendar Template ...
- Scatter Chart Examples | Bubble Plot | Four Dimensions Bubble Plot ...
- Blank Scatter Plot | Scatter Chart Examples | Scatter Plot | How To ...
- Blank Calendar Template | Business Calendar | Economic Calendar ...
- Blank Calendar Template | Business diagrams & Org Charts with ...
- Mind Map Blank Organisational Chart
- Blank Calendar Template | Business Calendar | Blank Calendar ...
- Schedule pie chart - Daily action plan | Chart Maker for ...


