
Example 1. Block Diagram Creator
What you need to design professional looking Block Diagram? ConceptDraw DIAGRAM offers you the new view on the process of diagrams creating. Now you don't need design from the blank sheet - you can use the ready template and fill it, or even the predesigned sample and change it for you needs. Block Diagrams Solution offers you a variety of templates and samples which are available from ConceptDraw STORE, and also 5 libraries with a lot of ready-to-use vector objects.
The predesigned objects from the libraries of Block Diagrams Solution let you the perfect possibility to design your Block Diagrams in minutes!

Example 2. Block Diagram - Gap Model of Service Quality
The following features make ConceptDraw DIAGRAM the best Block Diagram Creator:
- You don't need to be an artist to draw professional looking diagrams in a few minutes.
- Large quantity of ready-to-use vector objects makes your drawing diagrams quick and easy.
- Great number of predesigned templates and samples give you the good start for your own diagrams.
- ConceptDraw DIAGRAM provides you the possibility to use the grid, rules and guides. You can easily rotate, group, align, arrange the objects, use different fonts and colors to make your diagram exceptionally looking.
- All ConceptDraw DIAGRAM documents are vector graphic files and are available for reviewing, modifying, and converting to a variety of formats: image, HTML, PDF file, MS PowerPoint Presentation, Adobe Flash, MS Visio.
- Using ConceptDraw STORE you can navigate through ConceptDraw Solution Park, managing downloads and updates. You can access libraries, templates and samples directly from the ConceptDraw STORE.
- If you have any questions, our free of charge support is always ready to come to your aid.
TEN RELATED HOW TO's:
Beginning from the 19th century, people tried to tame electricity. Nowadays, electrical engineering covers a wide range of applications starting from providing illumination in our homes to developing space technologies. Considering the fact that every project needs documentation, engineers use electrical diagram software to develop these projects. Standard electrical symbols of electrical components are recognizable all around the world.
This illustration represents the 26 libraries that are supplied by the ConceptDraw Electrical Engineering solution. The Electric Engineering libraries contains about a thousand objects enabling you to draw various charts depicting electrical connections and circuits, along with schemes of different equipment and devices. The electric engineering libraries delivered with ConceptDraw solution meet the standards adopted in the image to electrical circuits. So they can be used by professionals along with amateurs in electrical engineering.
Picture: Electrical Diagram Software
Related Solution:
Any business process consists from a number of tasks carrying out the certain business goal. It is useful to diagram business processes to ensure that they are as foolproof, logical and sequential as possible. This business process diagram describes a typical booking process flow by the example of a cab booking process. It can be used as a roadmap for any booking system implementation. Diagramming a business process allows you to look at the entire project and take into account all types of possible scenarios. Business process diagram helps you investigate and clarify the process thoroughly so that you can find out how it can be improved. Business process diagram supports team communications by ensuring that each process element is clear and everyone in the team is on the same page.
Sometimes your company brings you less profit than you expect it to be, and it’s difficult to reveal the causes. Maybe it’s time to learn new technologies, because business diagram are easily developed by means of special software, so you won’t make any extra effort. In return, you will increase your productivity and get more done in a less time.
Picture: Business Diagram Software
Related Solutions:
A qualifying symbol is graphics or text added to the basic outline of a device’s logic symbol to describe the physical or logical characteristics of the device.
26 libraries of the Electrical Engineering Solution of ConceptDraw DIAGRAM make your electrical diagramming simple, efficient, and effective. You can simply and quickly drop the ready-to-use objects from libraries into your document to create the electrical diagram.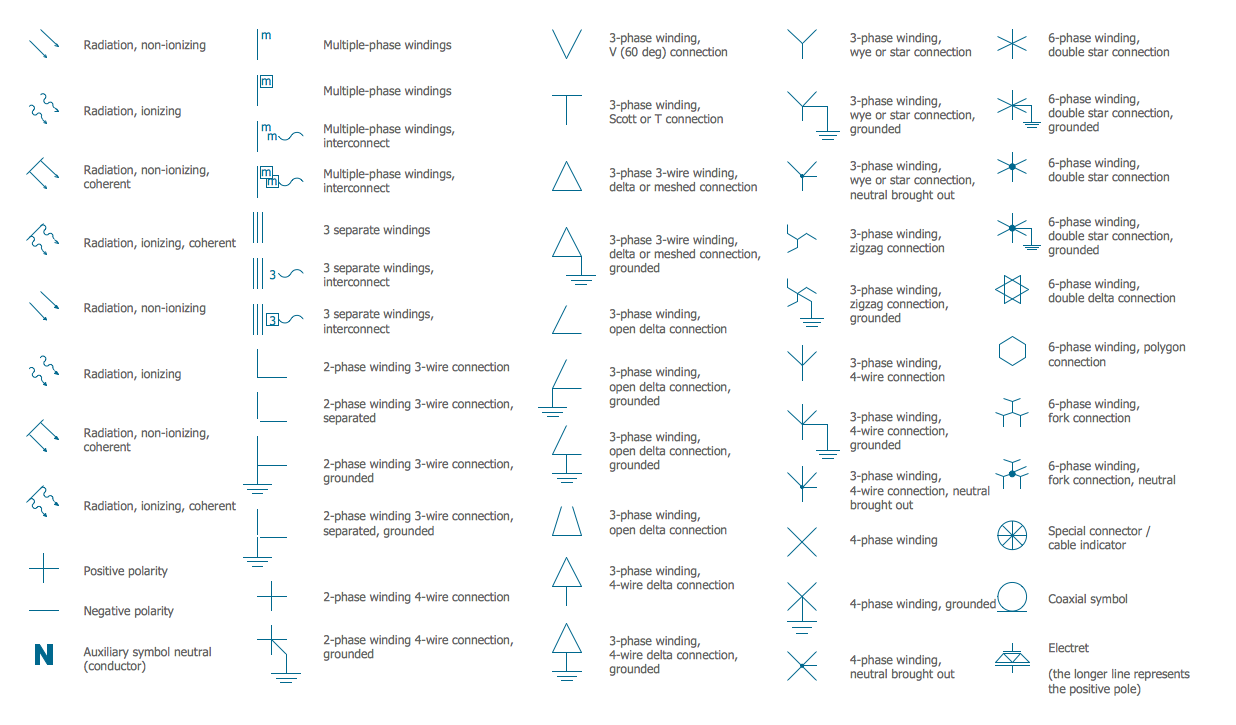
Picture: Electrical Symbols — Qualifying
Related Solution:
Chemical and Process Engineering solution contains variety predesigned process flow diagram elements relating to instrumentation, containers, piping and distribution necessary for chemical engineering, and can be used to map out chemical processes or easy creating various Chemical and Process Flow Diagrams in ConceptDraw DIAGRAM.
Picture: Process Flow Diagram Symbols
Related Solution:
The engineering diagrams produced with ConceptDraw DIAGRAM are vector graphic documents and are available for reviewing, modifying, and converting to a variety of formats (image, HTML, PDF file, MS PowerPoint Presentation, Adobe Flash or MS Visio XML).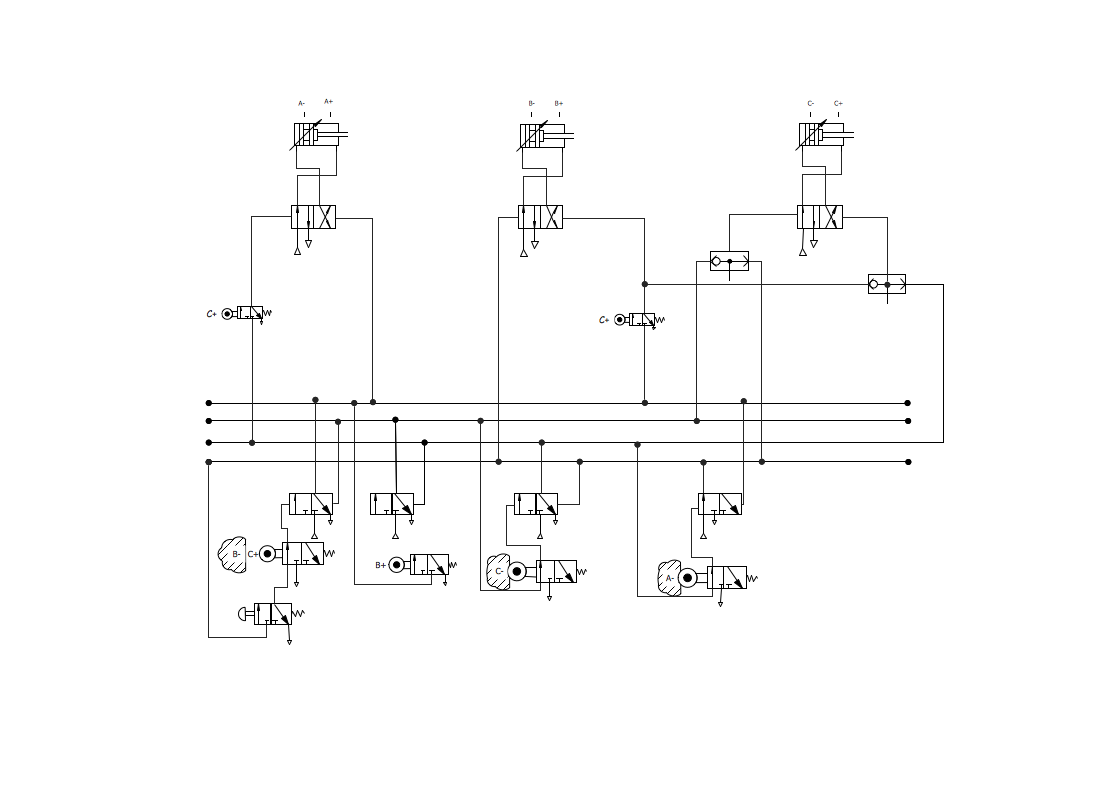
Picture: Making Mechanical Diagram
26 libraries of the Electrical Engineering Solution of ConceptDraw DIAGRAM make your electrical diagramming simple, efficient, and effective.
Picture: Electrical Symbols — Thermo
Related Solution:
Draw Cisco Network Topology and Cisco Computer Network Diagrams, Designs, Schematics, and Network Maps using ConceptDraw in no Time!
Cisco Network Diagrams solution also provides 15 libraries of 508 Cisco symbols for network components and points, LAN and WAN, schematic and wiring drawings.
Picture: Cisco Network Topology
Related Solution:
While studying, many of the students encounter the necessity of remaking class projects, over and over. To facilitate this process you can use special electrical and telecom plan software, which helps altering projects in several clicks. Using templates will fasten your work, and you will have more free time.
This sample represents an electrical and telecommunication floor plan. Electrical and telecom floor plans contain a floor plan , on which imposed the layout of electrical, and telecommunications equipment. They shows electrical and telecom details regarding the current floor of a building: lightening, fixtures, wires, outlets, circuit panels, etc. Using of standart notation of electrical and telecommunication symbols makes the plan understandable for engineers, architects, constructors, specialist in electricity and telecommunications.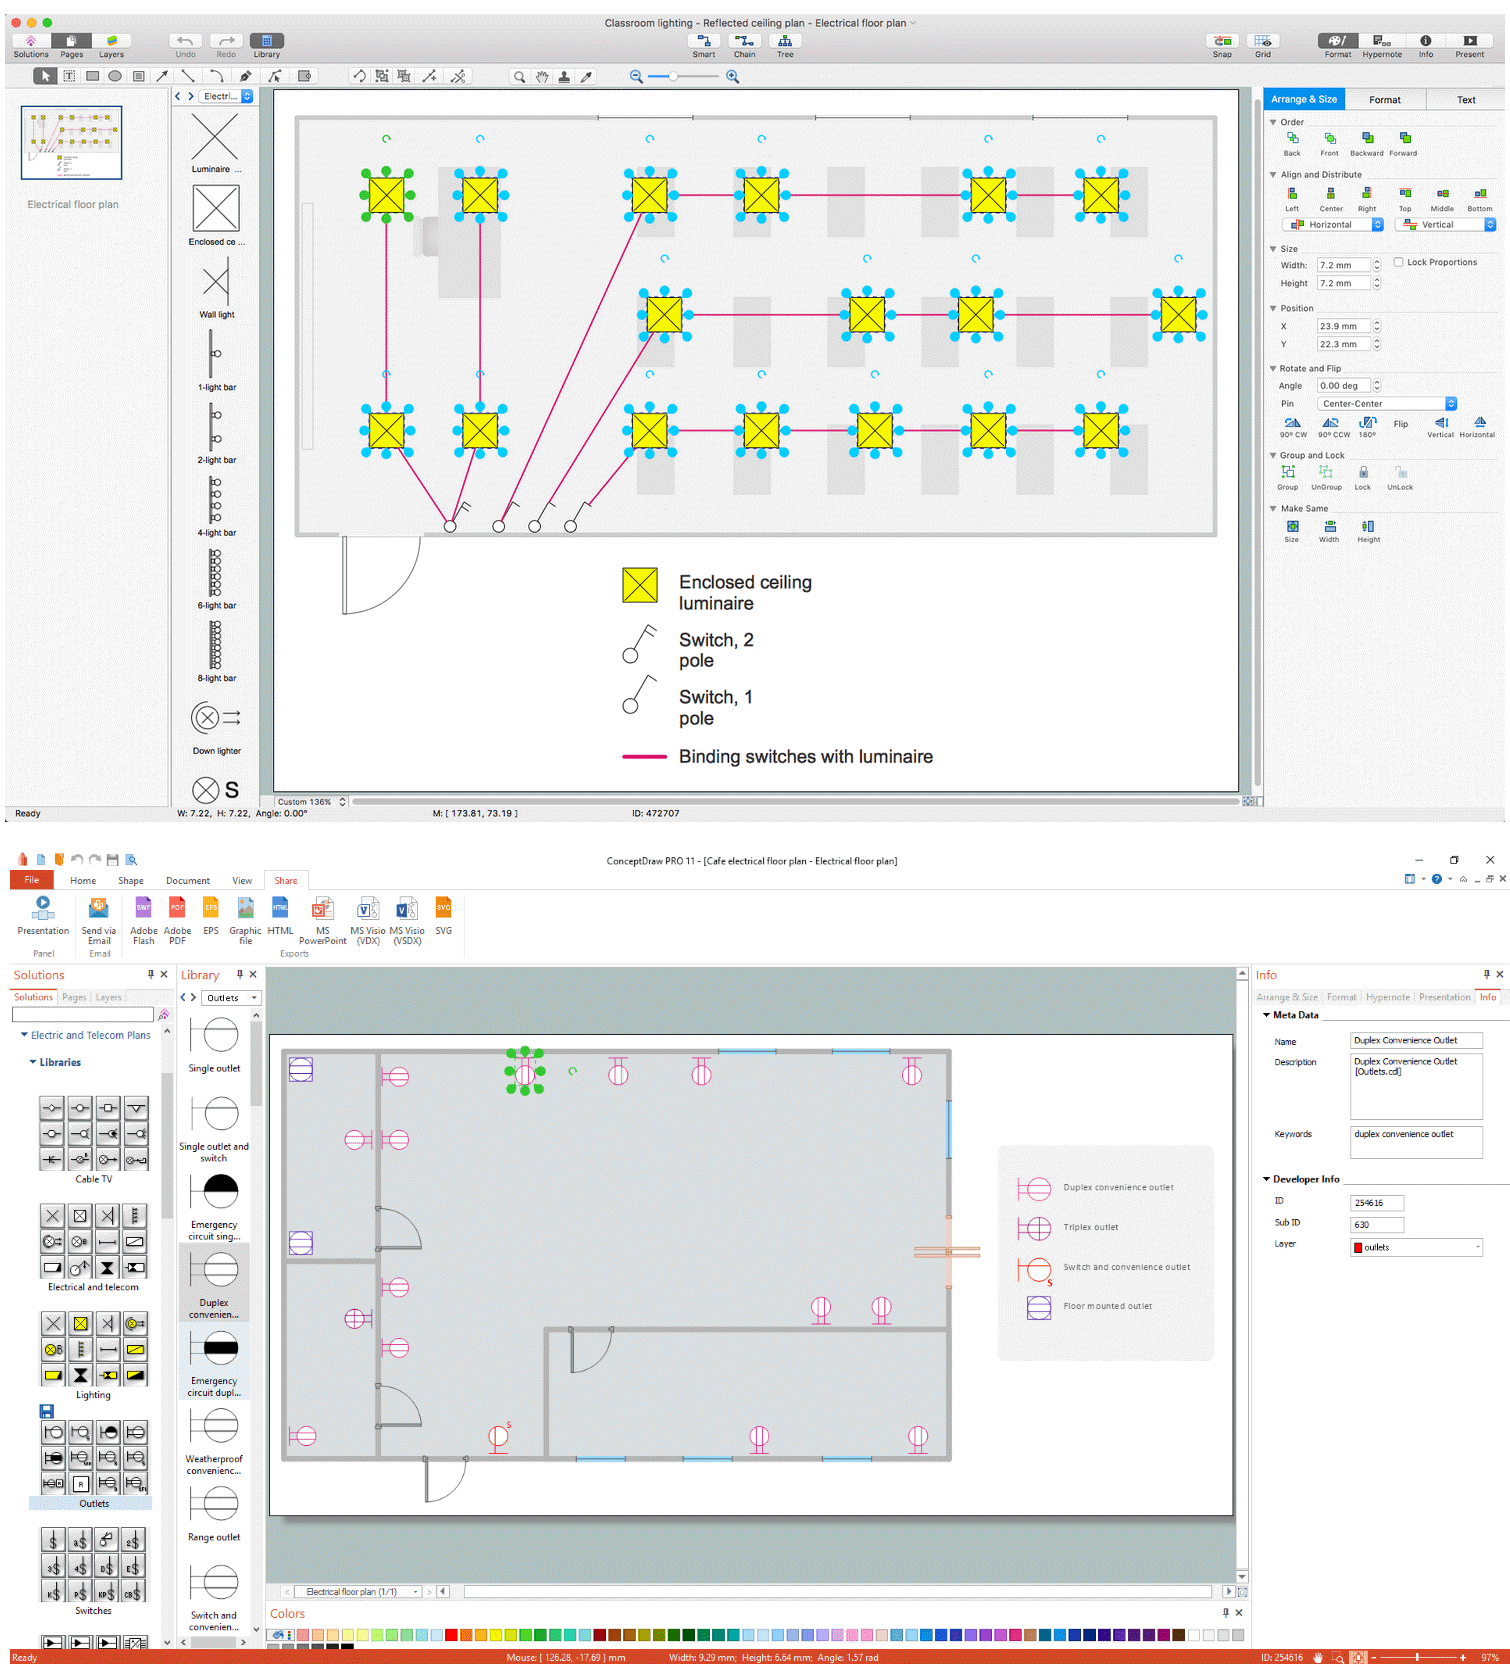
Picture: Electrical and Telecom Plan Software
Related Solution:
You need design the seating chart? The simple way is to use the specialized software. ConceptDraw DIAGRAM diagramming and vector drawing software extended with Seating Plans solution from the Building Plans area with powerful drawing tools, samples, seating chart template free will be ideal for you.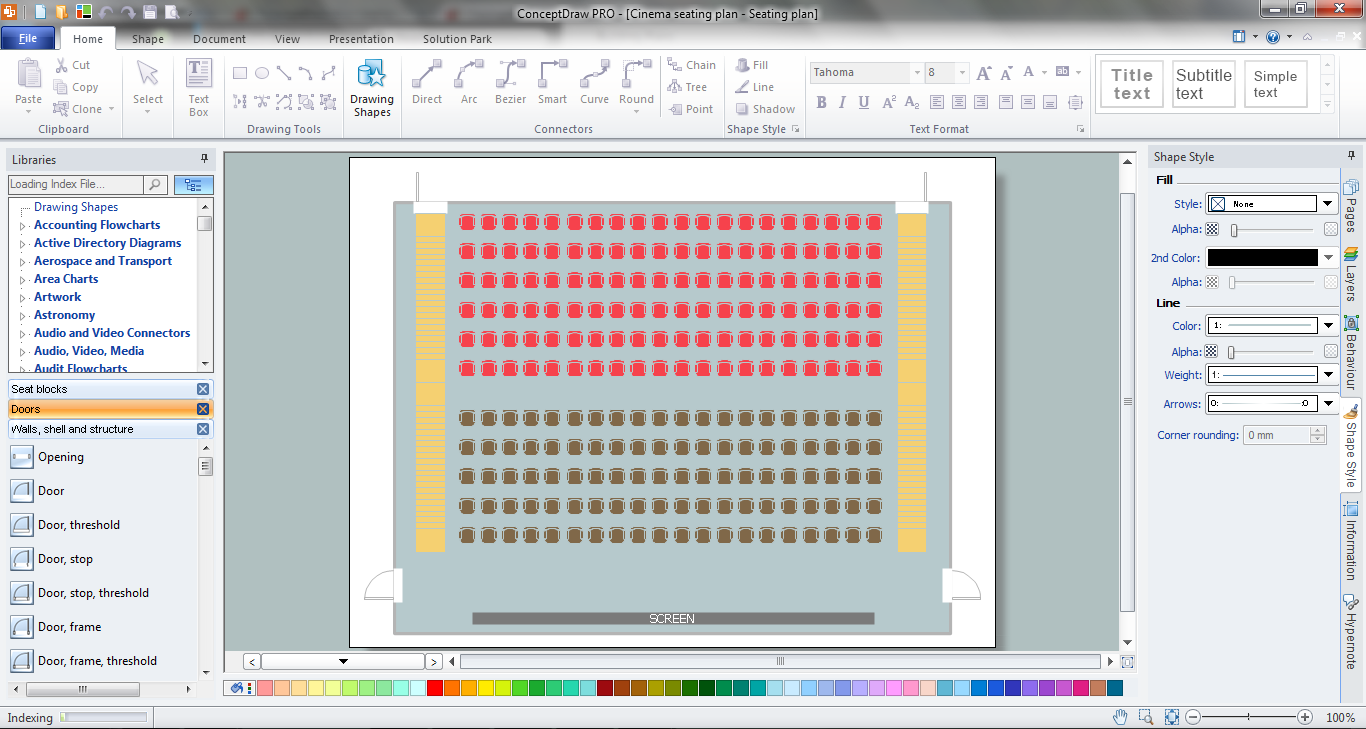
Picture: Seating Chart Template Free
Related Solution:
Software for flowchart diagrams can help you: represents an algorithm or process, illustrates a solution to a given problem, represented process operations, analyzing a business process, designing a business process, documenting a business process, optimizing a business process.
The Flowcharts Solution from the Diagrams area of ConceptDraw Solution Park contains a wide set of predesigned templates, samples and 3 libraries.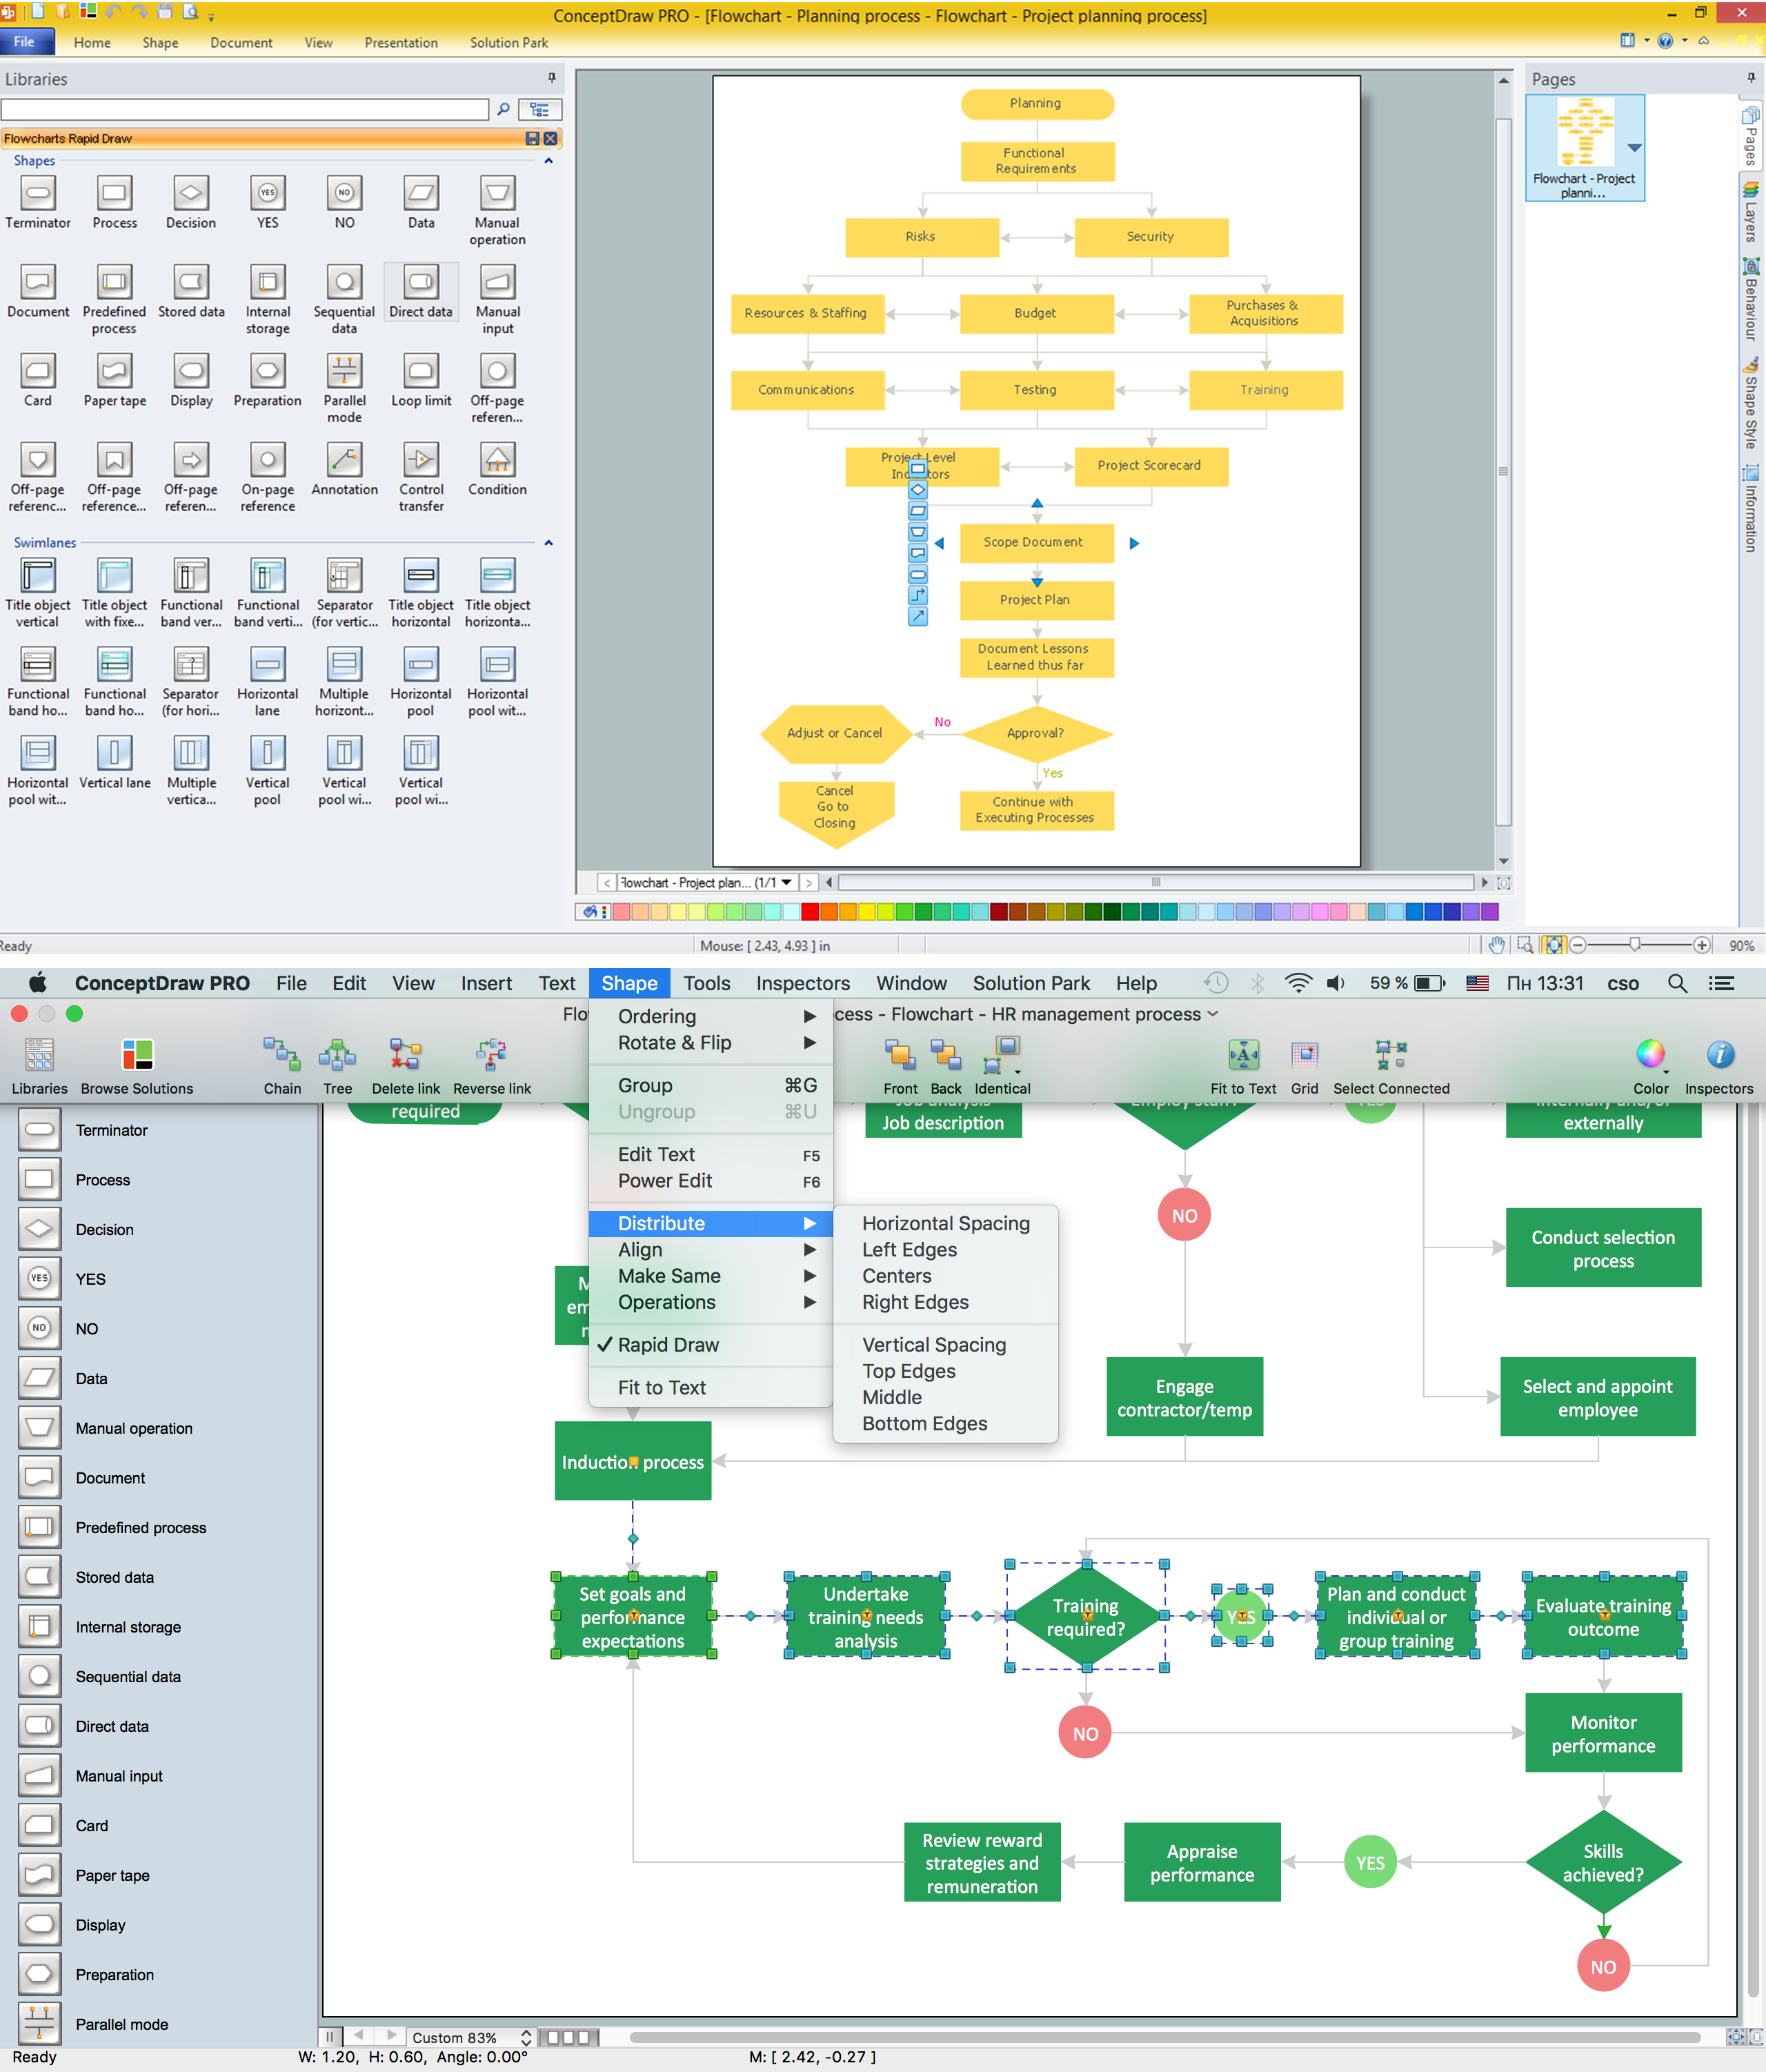
Picture: Software for flowchart diagrams
Related Solution:


