This site uses cookies. By continuing to browse the ConceptDraw site you are agreeing to our Use of Site Cookies.

Diagramming software for Amazon Web Service diagrams, charts and schemes

Professional software: visualize general system architecture, AWS diagrams are part of architecturing tools provided with ConceptDraw Solution Park.
"Network planning and design is an iterative process, encompassing topological design, network-synthesis, and network-realization, and is aimed at ensuring that a new telecommunications network or service meets the needs of the subscriber and operator. Network planning process involves three main steps: 1) Topological design: This stage involves determining where to place the components and how to connect them. 2) Network-synthesis: This stage involves determining the size of the components used, subject to performance criteria such as the Grade of Service (GoS). 3) Network realization: This stage involves determining how to meet capacity requirements, and ensure reliability within the network." [Network planning and design. Wikipedia]
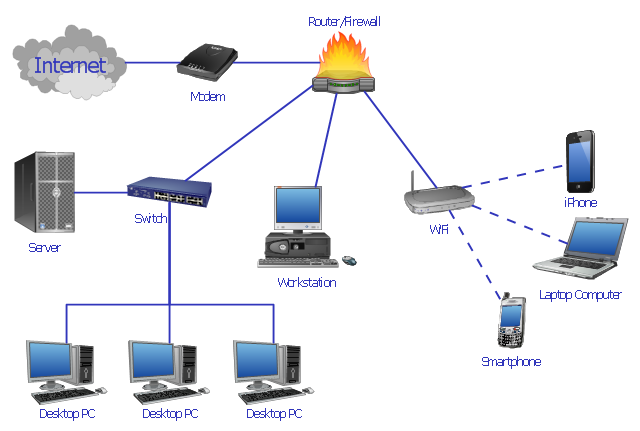
This computer network system design diagram example was created using the ConceptDraw PRO diagramming and vector drawing software extended with the Computer and Networks solution from the Computer and Networks area of ConceptDraw Solution Park.
Network system design
Network system design, workstation, wireless router, switch, smartphone, server, laptop computer, iPhone 4, hardware firewall, desktop PC, cloud, ADSL modem,

Structured Systems Analysis and Design Method. SSADM with ConceptDraw DIAGRAM

Structured Systems Analysis and Design Method (SSADM) was developed in the UK in the early 1980s and accepted in 1993 in order to analyze and project the information systems. Use the data flow diagrams (DFD) for describing the informational, functional and event-trigger models, the Logical Data Structure (LDS) diagrams for describing which data the system operates with and Entity Life History (ELH) diagrams for modelling events that happened in the system and find it simple to make any of these or other diagrams with help of our software. Starting now, you’ll definitely make a better chart tomorrow, so why not to do it now, at this very moment? Once you get used to ConceptDraw DIAGRAM , you’ll find our product to be the most smart version of any existing applications and you’ll recommend it to all those who you care for to simplify their work and their lives.

SSADM Diagram

The vector stencils library SSADM from the solution Systems engineering contains specific symbols of SSADM diagrams for ConceptDraw DIAGRAM diagramming and vector drawing software. The Systems engineering solution is contained in Software Development area of ConceptDraw Solution Park.
The example below illustrates the waterfall model used in SSADM. This model involves 5 stages of developing a product such as requirements specification and its' analysis, design, coding and testing.

Flowchart Components

The ConceptDraw Flowchart component includes a set of samples and templates. This geathered as flowchart maker toolbox which focused on drawing flowcharts of any industry standards.

JSD - Jackson system development

Jackson System Development (JSD) is a linear method of system development created by Michael A. Jackson and John Cameron in the 1980s. It comprises the whole software life cycle directly or providing a framework for more specialized techniques.
When implementing the Jackson System Development method and designing JSD diagrams, you can succesfully use the powerful and helpful tools of ConceptDraw DIAGRAM software extended with Entity-Relationship Diagram (ERD) solution from the Software Development area of ConceptDraw Solution Park.

UML Class Diagrams. Diagramming Software for Design UML Diagrams

In software engineering, a UML Class Diagrams is a type of static structure diagram that is used both for general conceptual modeling of the systematics of the application, and for detailed modeling translating the models into programming code.
Use ConceptDraw DIAGRAM with UML class diagram templates, samples and stencil library from Rapid UML solution to show the classes of system, their attributes, operations or methods, and the relationships among the classes.

System Design

ConceptDraw DIAGRAM system design software is a product of CS Odessa that was developed especially for making it much simpler to create all the needed diagrams, charts, flowcharts, schemes and other drawings when there is such a need in it. Having the Specification and Description Language (SDL) solution installed from the ConceptDraw STORE application may be another bonus to any ConceptDraw DIAGRAM diagramming and drawing software’s user as it offers both stencil libraries with the design elements and the pre-made examples of the diagrams, such as the SDL ones.

UML Class Diagram Example for GoodsTransportation System

Class Diagram for Goods Transport System in UML. This sample was created in ConceptDraw DIAGRAM diagramming and vector drawing software using the UML Class Diagram library of the Rapid UML Solution from the Software Development area of ConceptDraw Solution Park.
This sample shows the concept of working of the transport company and is used by transport companies, carriers at the transportation of various goods.

How To Create CCTV Network Diagram

Closed-circuit television (CCTV) uses cameras and monitors to carry out video surveillance. Unlike broadcast television this system has only local signal. It is a feature of almost every video camera, yet CCTV is mainly a system for visual control of certain areas such as banks, airports, supermarkets, and other places for security reasons.
Developing and installing CCTV system is a time-consuming process. It also requires certain knowledge and skills. ConceptDraw is a solution of setting video cameras rationally. You can achieve two aims at once: CCTV Design Tool saves your time and your money and helps you make professional video surveillance system.

Diagramming Software for Design UML Use Case Diagrams

Use Case Diagrams describes the functionality provided by a system in terms of actors, their goals represented as use cases, and any dependencies among those use cases.

Types of Flowcharts

A Flowchart is a graphically representation of the process, algorithm or the step-by-step solution of the problem. There are ten types of Flowcharts. Using the Flowcharts solution from the Diagrams area of ConceptDraw Solution Park you can easy and quickly design the Flowchart of any of these types.
How to Simplify Flow Charting
HelpDesk

How to Create a Computer Network Diagram

Computer Network diagram is intended to depict how a computer network is built and connected. It shows how data transfers between connections and presents an overview of hardware and devices used.
With the ConceptDraw solution for Computer Network Diagrams, system administrators, network architects, and other related IT specialists have a perfect drawing tool that supplies adjective vector stencils representing hardware, telecom devices, and logical symbols that enhance possibilities in network diagramming, however, complex the real network may be.

UML Object Diagram. Design Elements

UML Object Diagram shows the structure of a modeled system at a specific time.
ConceptDraw has 393 vector stencils in the 13 libraries that helps you to start using software for designing your own UML Diagrams. You can use the appropriate stencils of UML notation from UML Object library.

Diagramming software for Amazon Web Service icon set: Storage

Storage icons - Amazon AWS pro diagrams - AWS diagrams are part of architecturing tools provided with ConceptDraw Solution Park.

How to Create Flowcharts for an Accounting Information System

Accounting information is a system of processes to represent financial and accounting data that is used by decision makers. To represent accounting processes there are special symbols which are used to create accounting flowcharts.
Flowcharts help users of Accounting Information System to understand the step sequences of accounting processes. Use ConceptDraw DIAGRAM with Accounting Flowcharts solution to document and communicate visually how accounting processes work, and how each operation is done.

Data Flow Diagram

Data flow diagram (DFD) is the part of the SSADM method (Structured Systems Analysis and Design Methodology), intended for analysis and information systems projection. Data flow diagrams are intended for graphical representation of data flows in the information system and for analysis of data processing during the structural projection. Data flow diagram often used in connection with human process and can be displayed as workflow diagram. The critical Process Flow Diagram is another flowchart technique for designing data flow in connection with organizational processes. The critical Process flow diagram may use different range of symbols than a classic workflow diagram.

UML Package Diagram. Design Elements

UML Package Diagram illustrates the functionality of a software system.
ConceptDraw has 393 vector stencils in the 13 libraries that helps you to start using software for designing your own UML Diagrams. You can use the appropriate stencils of UML notation from UML Package library.

Crea Diagramas De Flujo

No need for any special drawing skills to create professional looking diagrams outside of your knowledge base. ConceptDraw DIAGRAM takes care of the technical details, allowing you to focus on your job, not the drawing.

Diagramming Software for Design UML Object Diagrams

UML Object Diagram shows the structure of a modeled system at a specific time.
ConceptDraw Rapid UML solution delivers libraries contain pre-designed objects fit UML notation, and ready to draw professional UML Object Diagram.