What Is a Circle Spoke Diagram

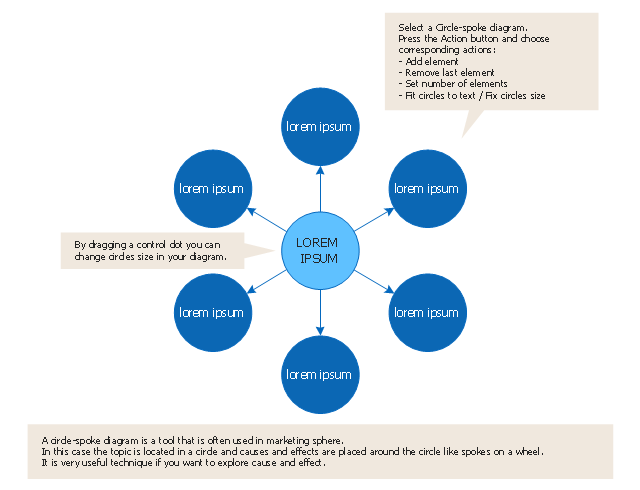
Circle Spoke Diagram Template

HelpDesk
How to Add a Circle-spoke Diagram to PowerPoint

HelpDesk
How to Add a Circle-Spoke Diagram to MS Word Document

HelpDesk
How To Make Visio Circle-Spoke Diagram

HelpDesk
How to Draw a Circle-Spoke Diagram

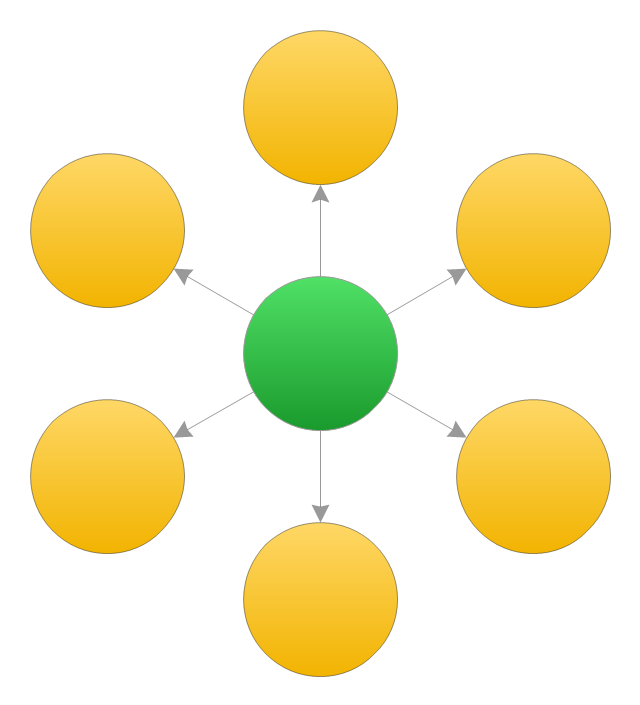
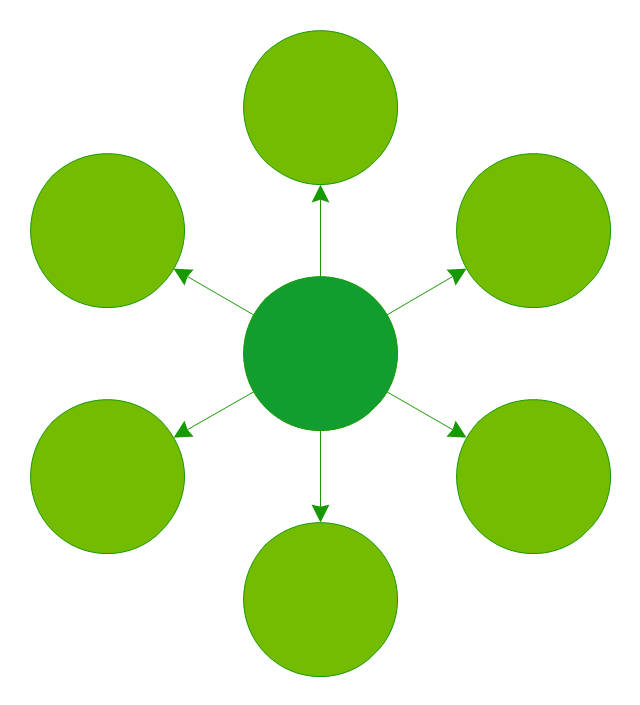
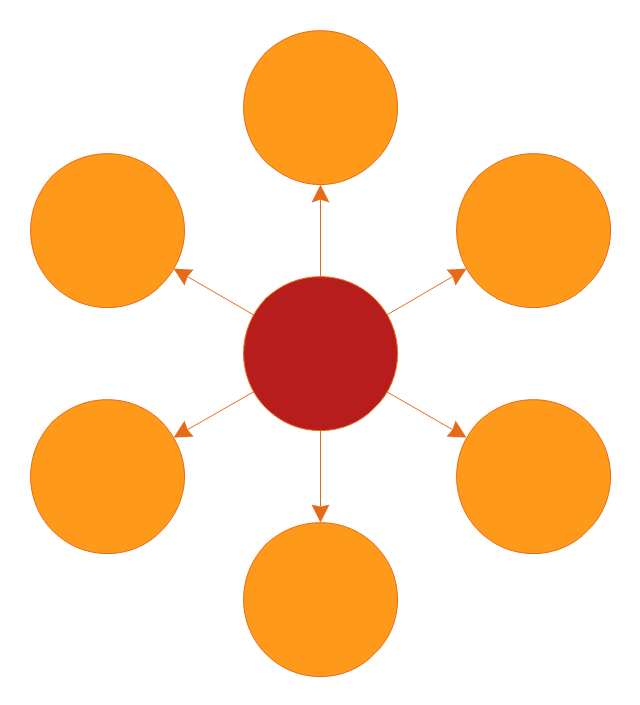
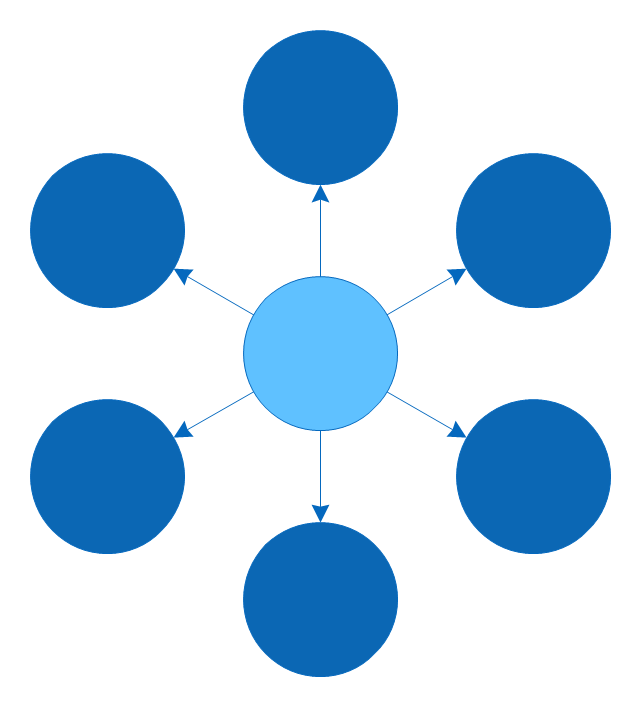
 Basic Circle-Spoke Diagrams
Basic circle-spoke diagrams are well suited for marketing, management documents, and presentations.
HelpDesk
How To Convert a Circle-Spoke Diagram to Adobe PDF

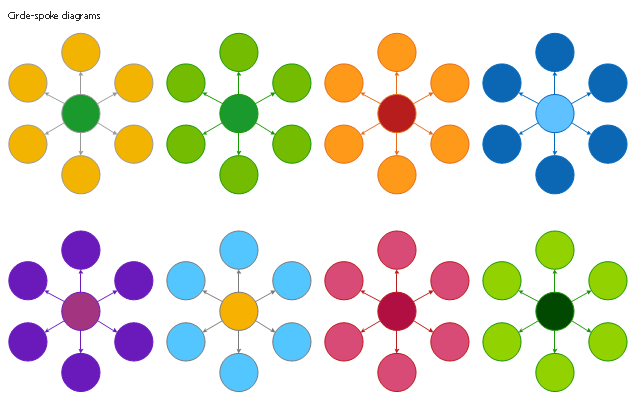
The vector stencils library "Circle-spoke diagram" contains 8 templates of circle-spoke diagrams.
Use these shapes to draw your circle spoke diagrams in the ConceptDraw PRO diagramming and vector drawing software extended with the Circle-Spoke Diagrams solution from the area "What is a Diagram" of ConceptDraw Solution Park.
Use these shapes to draw your circle spoke diagrams in the ConceptDraw PRO diagramming and vector drawing software extended with the Circle-Spoke Diagrams solution from the area "What is a Diagram" of ConceptDraw Solution Park.
Circle-Spoke Diagram 1
Circle-Spoke Diagram 2
Circle-Spoke Diagram 3
Circle-spoke diagram 4
Circle-Spoke Diagram 5
Circle-Spoke Diagram 6
Circle-Spoke Diagram 7
Circle-Spoke Diagram 8
Сircle-Spoke Diagrams (Spoke charts) have a central item surrounded by other items in a circle. They are used to show the features or components of the central item in marketing and management documents and presentations.
The template "Circle spoke diagram" for the ConceptDraw PRO diagramming and vector drawing software is included in the Circle-Spoke Diagrams solution from the area "What is a Diagram" of ConceptDraw Solution Park.
The template "Circle spoke diagram" for the ConceptDraw PRO diagramming and vector drawing software is included in the Circle-Spoke Diagrams solution from the area "What is a Diagram" of ConceptDraw Solution Park.
Template
The vector stencils library "Circle-spoke diagram" contains 8 templates for the ConceptDraw PRO diagramming and vector drawing software.
Circle-Spoke Diagrams (Spoke charts) have a central item surrounded by other items in a circle. The circle-spoke diagram is a diagram meant to illustrate that each spoke has equal value. Circle-spoke diagrams are used to show the relationships between a single main element and several satellites.
The circle-spoke diagrams are used to show the features or components of a central item in marketing, management documents and presentations.
The example "Design elements - Circle-spoke diagram" is included in the Circle-Spoke Diagrams solution from the area "What is a Diagram" of ConceptDraw Solution Park.
Circle spoke diagram templates
Circles Venn Diagram

Circle Diagrams

2 Circle Venn Diagram. Venn Diagram Example

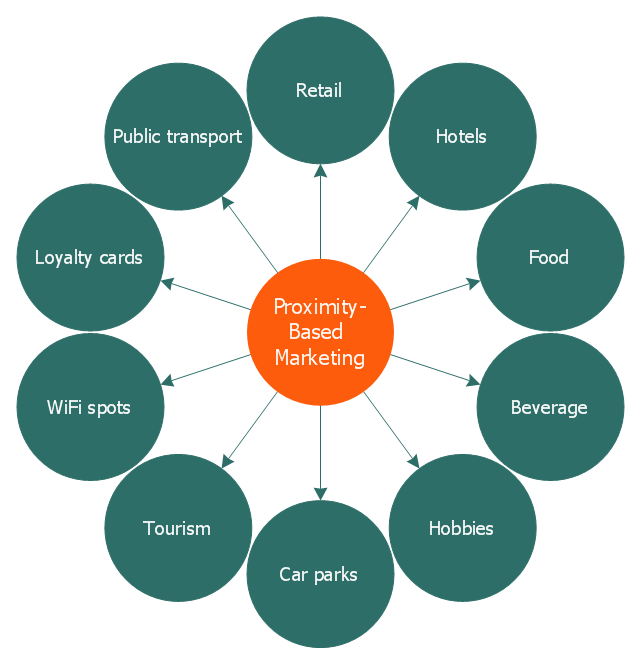
This circle-spoke diagram sample illustrates the proximity marketing.
"Proximity marketing is the localized wireless distribution of advertising content associated with a particular place. Transmissions can be received by individuals in that location who wish to receive them and have the necessary equipment to do so.
Distribution may be via a traditional localized broadcast, or more commonly is specifically targeted to devices known to be in a particular area.
The location of a device may be determined by:
(1) A cellular phone being in a particular cell.
(2) A Bluetooth or WiFi device being within range of a transmitter.
(3) An Internet enabled device with GPS enabling it to request localized content from Internet servers.
(4) A NFC enabled phone can read a RFID chip on a product or media and launch localized content from internet servers.
Communications may be further targeted to specific groups within a given location, for example content in tourist hot spots may only be distributed to devices registered outside the local area.
Communications may be both time and place specific, e.g. content at a conference venue may depend on the event in progress.
Uses of proximity marketing include distribution of media at concerts, information (weblinks on local facilities), gaming and social applications, and advertising." [Proximity marketing. Wikipedia]
The hub-and-spoke diagram example "Proximity based marketing" was created using the ConceptDraw PRO diagramming and vector drawing software extended with the Circle-Spoke Diagrams solution from the area "What is a Diagram" of ConceptDraw Solution Park.
Circle-spoke diagram
This circle-spoke diagram sample illustrates the target market concept.
"A target market is a group of customers towards which a business has decided to aim its marketing efforts and ultimately its merchandise. A well-defined target market is the first element to a marketing strategy. The marketing mix variables of product, place (distribution), promotion and price are the four elements of a marketing mix strategy that determine the success of a product in the marketplace." [Target market. Wikipedia]
The hub-and-spoke diagram example "Target market" was created using the ConceptDraw PRO diagramming and vector drawing software extended with the Circle-Spoke Diagrams solution from the area "What is a Diagram" of ConceptDraw Solution Park.
Circle-spoke diagram

This circle-spoke diagram sample shows how leadership and data provide essential coordination of other functions in an asset management environment. Leadership points the way and common data systems keep all divisions communicating effectively.
This circle-spoke diagram example was created on the base of illustration of article "Beyond the Short Term: Transportation Asset Management for Long-Term Sustainability, Accountability and Performance" from the website of The Federal Highway Administration (FHWA).
[fhwa.dot.gov/ asset/ 10009/ tam_ topr806_ 3.cfm]
"Asset management, broadly defined, refers to any system that monitors and maintains things of value to an entity or group. It may apply to both tangible assets such as buildings and to intangible concepts such as intellectual property and goodwill. Asset management is a systematic process of operating, maintaining, upgrading, and disposing of assets cost-effectively. Alternative views of asset management in the engineering environment are: the practice of managing assets to achieve the greatest return (particularly useful for productive assets such as plant and equipment), and the process of monitoring and maintaining facilities systems, with the objective of providing the best possible service to users (appropriate for public infrastructure assets)." [Asset management. Wikipedia]
The hub-and-spoke diagram example "Leadership and data" was created using the ConceptDraw PRO diagramming and vector drawing software extended with the Circle-Spoke Diagrams solution from the area "What is a Diagram" of ConceptDraw Solution Park.
Circle-spoke diagram

This circle-spoke diagram sample shows the social determinants of health. It was created on the base of the hub-and-spoke diagram from the Health Canada website. [hc-sc.gc.ca/ sr-sr/ pubs/ hpr-rpms/ bull/ 2005-climat/ 2005-climat-6-eng.php]
"Social determinants of health are the economic and social conditions – and their distribution among the population – that influence individual and group differences in health status. They are risk factors found in one's living and working conditions (such as the distribution of income, wealth, influence, and power), rather than individual factors (such as behavioural risk factors or genetics) that influence the risk for a disease, or vulnerability to disease or injury. According to some viewpoints, these distributions of social determinants are shaped by public policies that reflect the influence of prevailing political ideologies of those governing a jurisdiction. ...
In 2003, the World Health Organization (WHO) Europe suggested that the social determinants of health included:
(1) Social gradients (life expectancy is shorter and disease is more common further down the social ladder).
(2) Stress (including stress in the workplace).
(3) Early childhood development.
(4) Social exclusion.
(5) Unemployment.
(6) Social support networks.
(7) Addiction.
(8) Availability of healthy food.
(9) Availability of healthy transportation." [Social determinants of health. Wikipedia]
The hub-and-spoke diagram example "Social determinants of health" was created using the ConceptDraw PRO diagramming and vector drawing software extended with the Circle-Spoke Diagrams solution from the area "What is a Diagram" of ConceptDraw Solution Park.
Circle-spoke diagram

This circle-spoke diagram sample shows the Porter five forces model. It was designed on the base of the Wikimedia Commons file: Modelo Porter.png. [commons.wikimedia.org/ wiki/ File:Modelo_ Porter.png]
"Porter's five forces analysis is a framework that attempts to analyze the level of competition within an industry and business strategy development. It draws upon industrial organization (IO) economics to derive five forces that determine the competitive intensity and therefore attractiveness of an Industry. Attractiveness in this context refers to the overall industry profitability. An "unattractive" industry is one in which the combination of these five forces acts to drive down overall profitability. A very unattractive industry would be one approaching "pure competition", in which available profits for all firms are driven to normal profit. This analysis is associated with its principal innovator Michael E. Porter of Harvard University. ...
Porter's five forces include – three forces from 'horizontal' competition: the threat of substitute products or services, the threat of established rivals, and the threat of new entrants; and two forces from 'vertical' competition: the bargaining power of suppliers and the bargaining power of customers." [Porter's five forces analysis. Wikipedia]
The hub-and-spoke diagram example "Porter five forces model" was created using the ConceptDraw PRO diagramming and vector drawing software extended with the Circle-Spoke Diagrams solution from the area "What is a Diagram" of ConceptDraw Solution Park.
Circle-spoke diagram

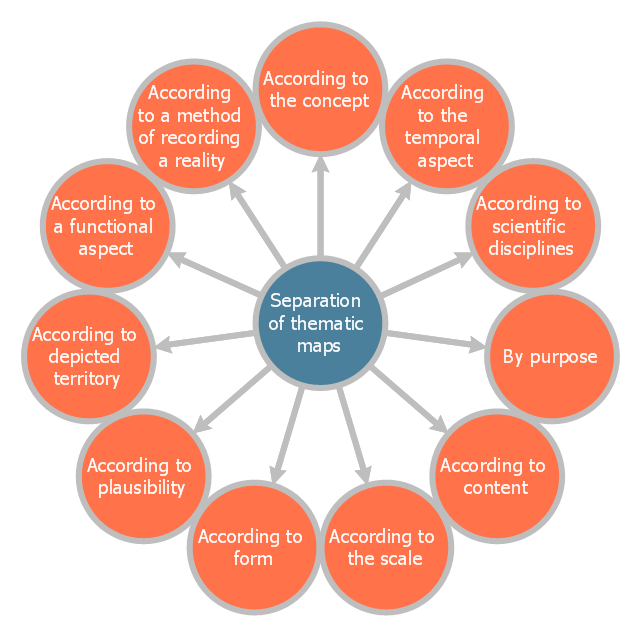
This circle-spoke diagram sample shows the basic division of thematic maps. It was designed on the base of the Wikimedia Commons file: Dělení tematických map.png.
[commons.wikimedia.org/ wiki/ File:D%C4%9Blen%C3%AD_ tematick%C3%BDch_ map.png]
This file is licensed under the Creative Commons Attribution-Share Alike 4.0 International license. [creativecommons.org/ licenses/ by-sa/ 4.0/ deed.en]
"A thematic map is a map that focuses on a specific theme or subject area. This is in contrast to general reference maps, which regularly show the variety of phenomena — geological, geographical, political — together. The contrast between them lies in the fact that thematic maps use the base data, such as coastlines, boundaries and places, only as points of reference for the phenomenon being mapped. General maps portray the base data, such as landforms, lines of transportation, settlements, and political boundaries, for their own sake.
Thematic maps emphasize spatial variation of one or a small number of geographic distributions. These distributions may be physical phenomena such as climate or human characteristics such as population density and health issues." [Thematic map. Wikipedia]
The hub-and-spoke diagram example "Division of thematic maps" was created using the ConceptDraw PRO diagramming and vector drawing software extended with the Circle-Spoke Diagrams solution from the area "What is a Diagram" of ConceptDraw Solution Park.
Circle-spoke diagram
- Circle- Spoke Diagrams
- Circle- Spoke Diagrams | Proximity based marketing | Hubs And ...
- Spoke Diagram Brainstorming
- Circle Spoke Diagram Template
- What Is a Circle Spoke Diagram
- Social determinants of health | Circle- spoke diagram - Vector ...
- Spoke Diagram Definition
- How To Create a Visio Circle- Spoke Diagram Using ConceptDraw ...
- Circle- spoke diagram - Vector stencils library
- Social determinants of health | Circle- Spoke Diagrams | Circle ...
- Circle Diagrams | Circle- Spoke Diagrams | Circles Venn Diagram ...
- Target market | Circle Spoke Diagram Template | Target and ...
- Social determinants of health - Hub-and- spoke diagram | Circle ...
- Social determinants of health | Circle- Spoke Diagrams | Basic Circle ...
- How to Draw a Circle- Spoke Diagram Using ConceptDraw PRO ...
- Circle Spoke Diagram Template | Target Diagram | Target diagrams ...
- Circle Spoke Diagram 4
- What Is a Circle Spoke Diagram
- Circle- Spoke Diagrams
- Circle- spoke diagram - Target market | Target Diagram | Circular ...
- ERD | Entity Relationship Diagrams, ERD Software for Mac and Win
- Flowchart | Basic Flowchart Symbols and Meaning
- Flowchart | Flowchart Design - Symbols, Shapes, Stencils and Icons
- Flowchart | Flow Chart Symbols
- Electrical | Electrical Drawing - Wiring and Circuits Schematics
- Flowchart | Common Flowchart Symbols
- Flowchart | Common Flowchart Symbols